Land Use Efficiency
Land Use Efficiency by Project
A land use efficiency analysis was performed by calculating the amount of renewable electricity a facility expected to produce in a year and dividing this number by the total acreage that the facility expected to disturb. This served as our metric for the land use efficiency of a given project. Table 1 summarizes the results. By using this analysis tool to quantify the relationship between the technology type, size of facility footprint, and the amount of energy being produced, we are able to compare the
| Proposal Name | Nameplate Capacity | MWh Produced/ Acre Disturbed | CSP or PV | Technology Type |
|---|---|---|---|---|
| Solar Millennium - Blythe | 1000.0 | 352.11 | CSP | Parabolic Trough |
| Solar Millennium - Ridgecrest | 250 | 283.9 | CSP | Parabolic Trough |
| Solar Millennium - Palen | 484 | 336.5 | CSP | Parabolic Trough |
| Beacon Solar Energy Project | 250 | 455.95 | CSP | Parabolic Trough |
| Abengoa Mojave | 250 | 409.6 | CSP | Parabolic Trough |
| Genesis Solar | 250 | 407.00 | CSP | Parabolic Trough |
| City of Palmdale - Hybrid Gas-Solar | 62 | 356.46 | CSP | Parabolic Trough |
| Parabolic Trough Average | 364 | 371.65 | CSP | Parabolic Trough |
| Calico (formerly Solar One) | 850 | 1000.2 | CSP | Stirling Engine |
| Imperial Valley (formerly Solar Two) | 750 | 845.2 | CSP | Stirling Engine |
| Dish/Engine Average | 800 | 922.70 | CSP | Stirling Engine |
| Chevron Lucerne Valley | 60 | 211.55 | PV | Thin-Film |
| FirstSolar's Desert Sunlight | 550 | 226.90 | PV | Thin-Film |
| Thin Film PV Average | 305 | 219.23 | PV | Thin-Film |
| Ivanpah | 400 | 991.70 | CSP | Power Tower |
| Rice Solar Energy Project | 150 | 315.84 | CSP | Power Tower |
| Power Tower Average | 275 | 653.77 | CSP | Power Tower |
| TOTAL AVERAGE | 427 | 523.13 |
relative land use efficiencies of the proposals on both a project-by-project basis as well as on a technology-versus-technology basis. In a project-by-project comparison, this analysis shows which proposed facility is making relatively better use of the land by producing a greater quantity of energy per unit of area. In short, the project with the best ratio, in this case the highest amount of megawatt-hours of electricity produced per acre of land disturbed, could be viewed as the most efficient project in terms of land use. This is a simplified way of determining which project will have a relatively “smaller” environmental footprint while still maximizing the amount of electricity that is produced by the facility.
As can be seen in Table 1, there is a substantial range of land use efficiencies, with the Solar Millennium Ridgecrest project having the lowest efficiency at 284 MWh of electricity produced per acre of land disturbed, and the Tessera Calico project having the highest efficiency at 1,000 MWh of electricity produced per acre of land disturbed.
Land Use Efficiency by Technology Type
An analysis across technology types was also performed. Although the majority of applications are for parabolic trough systems, there are also other types of solar technologies being proposed, including power tower, dish/engine, and thin film PV. Each of these technologies has its own distinct set of advantages and disadvantages, including relative operating efficiencies, land requirements, and cooling system needs. By calculating the average land use efficiency for each technology type, we are able to see which technologies appear to have higher land use needs, and thus a greater ecological impact. A breakdown of the average land use efficiencies by technology type, as well as an average across technology types and the maximum and minimum values, is shown below in Figure 1.
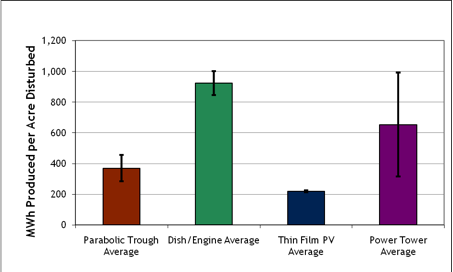
This analysis shows the effect that technology type has on the overall facility footprint. The above results indicate that thin film PV and parabolic trough systems have the lowest average land use efficiency of these four technologies. For parabolic trough and thin film PV systems, this is likely due to the fact that these systems require long, contiguous rows of panels or mirrors to be constructed on a three percent grade or less. This requirement means that a greater portion of the site must be graded to accommodate the technology. In contrast, technology types that have fewer land constraints have higher land use efficiencies. An example is the dish/engine system, which can be placed in non-contiguous configurations and can tolerate slopes up to six percent. Since dish/engines can be anchored to the ground independently of one another, this eliminates the need to grade the entire solar field to a consistent level, which results in a lower overall grading requirement. In turn, this means there will be fewer disturbances to soil crusts, native vegetation, and wildlife species, which may contribute to the high average land use efficiency of this technology type.
This analysis can serve as a preliminary dataset for stakeholders to determine which technologies appear to be maximizing energy production while keeping facility footprint and related ecological impacts relatively low. Yet, it is important to keep in mind that these averages are currently based on only 13 projects, with some technology types only having two projects to draw data from.