Introduction
Many of the potential conflicts and benefits of the proposed solar facilities are spatial in nature. The location of a facility determines whether the benefits outweigh the costs, or vice versa. Geographic Information Systems (GIS) can be used to understand the issues of siting solar facilities in the California desert. The spatial analyses we conducted allows for a visual and quantitative comparison across different variables, such as sensitive habitat and visual footprint, providing information and perspective that cannot be supplied by our other analyses.
Purpose of Spatial Analyses
We used spatial analyses to examine three potential development scenarios and the effects that these scenarios have on ecological and visual resources. The three potential development scenarios are:
- Only proposed solar facilities labeled as “Fast Track” applications are built (10 projects total);
- Only proposed solar facilities located in Solar Energy Study Areas (SESAs) are built (22 projects total);
- All currently proposed solar facilities (as of March 2010) are built (54 projects total).
While it is unlikely that any of these three scenarios will manifest exactly as we analyzed them, they represent a wide range of possibilities that can be illustrative of likely impacts should any combination of facilities be built throughout the California desert landscape. The “Fast Track” application scenario was chosen because these applications are those that are most likely to be approved first, and may represent a first wave of development. The “SESA” application scenario was chosen because, pending adoption of the Solar Programmatic Environmental Impact Statement (PEIS), development will likely be actively promoted in these areas. The third scenario of full build-out of “All Proposed” facilities was chosen as a proxy for the maximum extent of development in the near future. We used these scenarios to conduct ecological impact analyses and a visual impact analysis.
Study Area
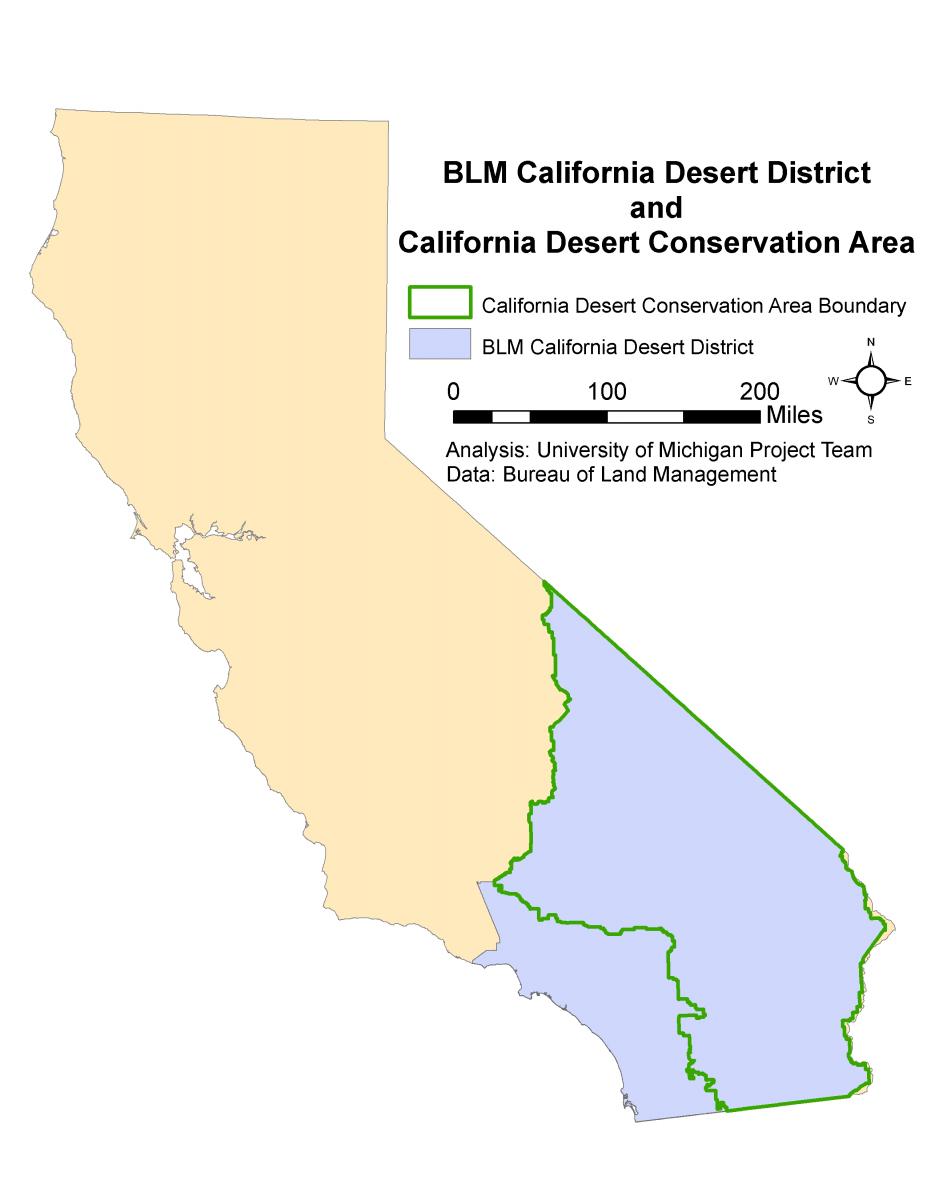
We used two different geographic boundaries for these analyses: the California Desert District (CDD) and the California Desert Conservation Area (CDCA) (Map 1). The CDD is a BLM administrative area and is the functional unit for the management of the California desert ecosystem. It encompasses approximately the lower third of the State of California. The CDCA is the ecological boundary of the California desert landscape and represents the area where impacts from solar development could occur. Most data files were clipped to either the CDD or the CDCA depending on the type of data; because the CDD covers such a large area, data were sometimes clipped to the CDCA to reduce their file size.