Distributed Generation Potential
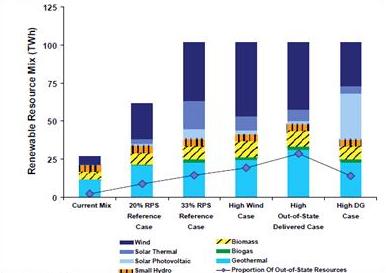
Meeting renewable energy goals in California will require both utility-scale and distributed generation approaches to solar development. The complementary approaches to electricity generation and delivery enable utilities, developers, and consumers to cooperatively invest in solar energy development in a number of market sectors and take advantage of a variety of investment incentives that economize investment at all scales. California’s preliminary analysis of the implementation scenarios for meeting the 33 percent RPS goal explored the potential for a high level of distributed solar electricity generation capacity1 based on three screens: ease of interconnection, site suitability, and customer’s willingness to install the technology (Figure 1). GIS mapping of available rooftop area and analysis of peak load service were used to construct the screens and the statewide potential for PV applications totaled 17,300 MW,2 or about 30 TWh (assuming a 20 percent capacity factor). California will require approximately 75 TWh of new renewable electricity generation capacity by 2020 in order to meet the RPS goal.3
Distributed generation has the potential to contribute significantly to the state’s energy portfolio but will not replace utility-scale development. While distributed generation offers many benefits, such as rapid deployment and use of rooftops or disturbed land in developed areas, several barriers exist, including behavioral preferences, higher costs and questions about ownership of Renewable Energy Credits (RECs).
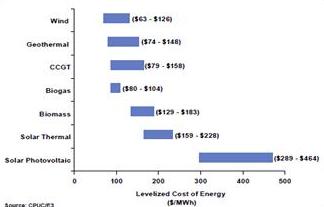
The most common technology used for distributed generation is combined heat and power for industrial processes (i.e. using waste heat to generate energy), but policy-based incentives are fueling the growth of the PV market for commercial and residential distributed generation. The modular nature of PV panels is appropriate for rooftop applications or ground-level arrays sized according to the energy demand of the site or the space available. Utility customers can take advantage of many of the same economic incentives as a developer of a large solar facility but have the advantage of streamlined interconnection rules and regulations, which cuts overall project costs. Because a distributed generation solar electric system reduces demand for electricity from the grid during peak periods of demand, customers with time-of-use rate pricing can take advantage favorable net metering rates. Pacific Gas and Electric, for example, offers residential customers with PV installations up to 1 MW a time-of-use net metering rate that values solar energy produced during peak periods at a rate three times higher than during non peak periods.4 Utilities support distributed generation because projects can come on line quickly, reduce peak load demand, and contribute to RPS goals. However, PV remains more expensive per MWh5 (Figure 2), which is a major barrier to widespread adoption despite numerous economic incentives.