California’s Incentives for Distributed Generation
During the period from 1990 through 1999, overall electricity demand in California increased by 11.3 percent while electric generating capacity decreased by 1.7 percent over the same period.1 The imbalance between electricity supply and demand came to a head during California’s energy crisis of 2000 to 2001, when the state endured rolling blackouts during the summer peak demand periods. Skyrocketing wholesale electricity costs forced utilities to limit supply to customers who enjoyed artificially low, regulated electricity billing rates. Wholesale electricity market prices exhibited “significant departures from competitive pricing during the high-demand summer months and near- competitive pricing during the lower-demand months” between 1998 and 1999 and increased significantly in 2000.2 This increase was likely due to rent-seeking behaviors and inequitable market power among generators in the recently restructured market rather than to rising fuel costs or environmental costs. While an in-depth discussion of California’s energy market restructure and consequences is outside the scope of this review, it is worth noting for its contribution to the energy crisis and the subsequent policies created to address market failures and increase alternative, competitively priced distributed electric generation capacity. Today, not only is distributed generation important for California’s energy security, it is a boon to the state’s economic development and plays a significant role in meeting renewable energy goals.
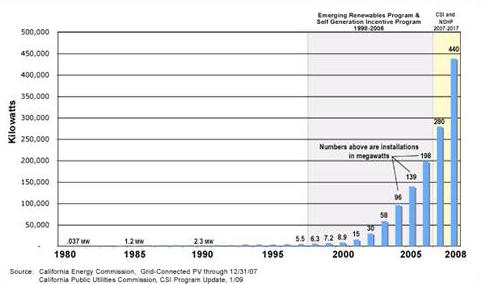
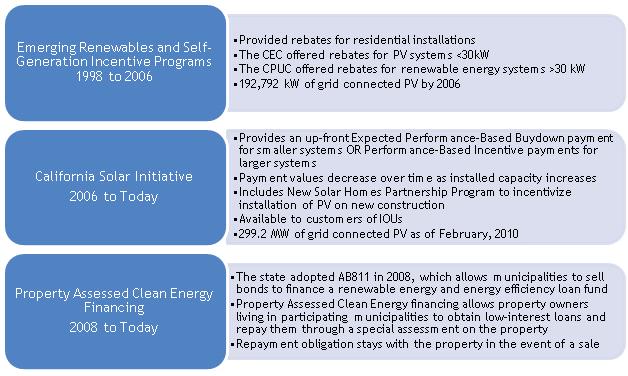
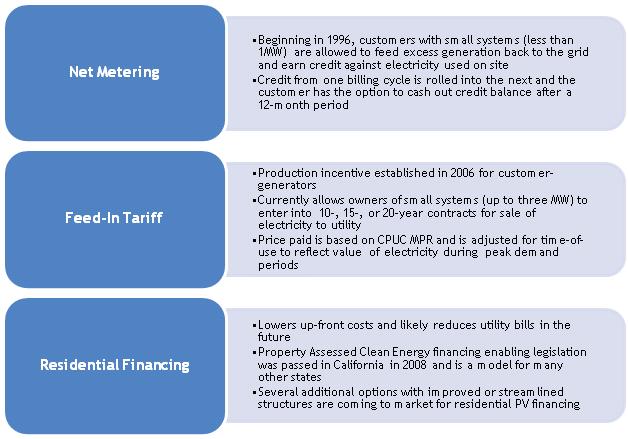
As policy measures are introduced and extended to reduce uncertainties and enable widespread adoption of solar technologies, opportunities for improvements and investment in the distributed generation solar market arise. As with utility-scale projects, the PV market creates a value chain starting with research and development, followed by investment, material supply and manufacturing, project development, labor and installation, legal, financial and environmental consulting, and ultimately, the consumer. Rapid evolution of the industry over the past decade coupled with uncertainty of policy incentives and market externalities over the extended economic life cycle of product creates points throughout the value chain that are dependent on favorable policy and incentives. The market for PV is growing rapidly in California (Figure 1) with the support of progressive and ambitious renewable energy goals. California’s incentive programs (Table 15,6) and pricing policies (Table 2) for distributed generation resulted in over 24,000 distributed PV installations with a combined capacity of 459 MW between 1998 and 2008.3 California’s innovative programs targeted specifically at adoption of residential solar power also support a growing workforce of specialized distributors and installers.
Private sector start-ups are beginning to enter the market for residential financing and will offer homeowners additional options and structures for obtaining low-cost capital for PV systems. One alternative recently offered by SunRun, Inc. in California is third-party ownership of the solar PV system. The structure involves establishing a power purchase agreement whereby the homeowner provides a down payment and agrees to purchase electricity produced by the system at a locked-in rate over 18 years.4 SunRun installs, owns, and maintains the system, thus reducing overall costs for the homeowner. This approach may prove to be an attractive complement or alternative to PACE financing. Additional financing structures are summarized in Table 37.
| Residential PV Matrix from Homeowners’ Perspective | Purchase with Cash | Home Equity Loan | Solar Lease | Residential PPA- SunRun Power Plan | Property Tax Model- PACE | PSE&G Solar REC Loan Program |
|---|---|---|---|---|---|---|
| Up-front cost to homeowner | 36-70% | None/Low | 0-20% | 5-25% | None/Low | 0.36 |
| Homeowner has maintenance responsibilities | Yes | Yes | Depends on program | No | Yes | Yes |
| Homeowner Pays for Inverter Replacement | Yes | Yes | Depends on program | No | Yes | Yes |
| Likely impact on future utility bills* | Lower | Lower | Lower | Lower** | Lower | Lower |
| Required cash payments (above utility bills) | No | Yes- loan payment | Yes- lease payment | Yes- electricity payment | Yes- property tax payment | No- although annual true-ups possible |
| Ownership of PV system in Year 1 | Yes | Yes | No | No | Yes | Yes |
| Take residential federal tax credit | Yes | Yes | No | No | Yes*** | Yes*** |
* Compared to buying 100% of the electricity from the local utility. This does not mean that other costs, such as a loan or lease payment will be 100% offset by retail utility bill savings.
** The third-party PPA ownership model assumes that retail electricity prices will exceed the PPA price. While likely unless structured as a fixed discount to retail prices, it is not guaranteed.
*** Based on the proposed changes to the subsidized energy financing concept in the stimulus bill.