Conclusions
The four SESAs in the California desert were chosen under the Solar PEIS process for their high solar resources, suitable slope, proximity to roads and transmission, avoidance of areas with important visual resources, and avoidance of sensitive and wilderness lands, including threatened and endangered species designated critical habitat, Areas of Critical Environmental Concern (ACECs), and wildlife movement corridors.1,2 Based on the results of our spatial analyses, these selection criteria were effective in choosing areas for development that would minimize impacts to both ecological and visual resources.
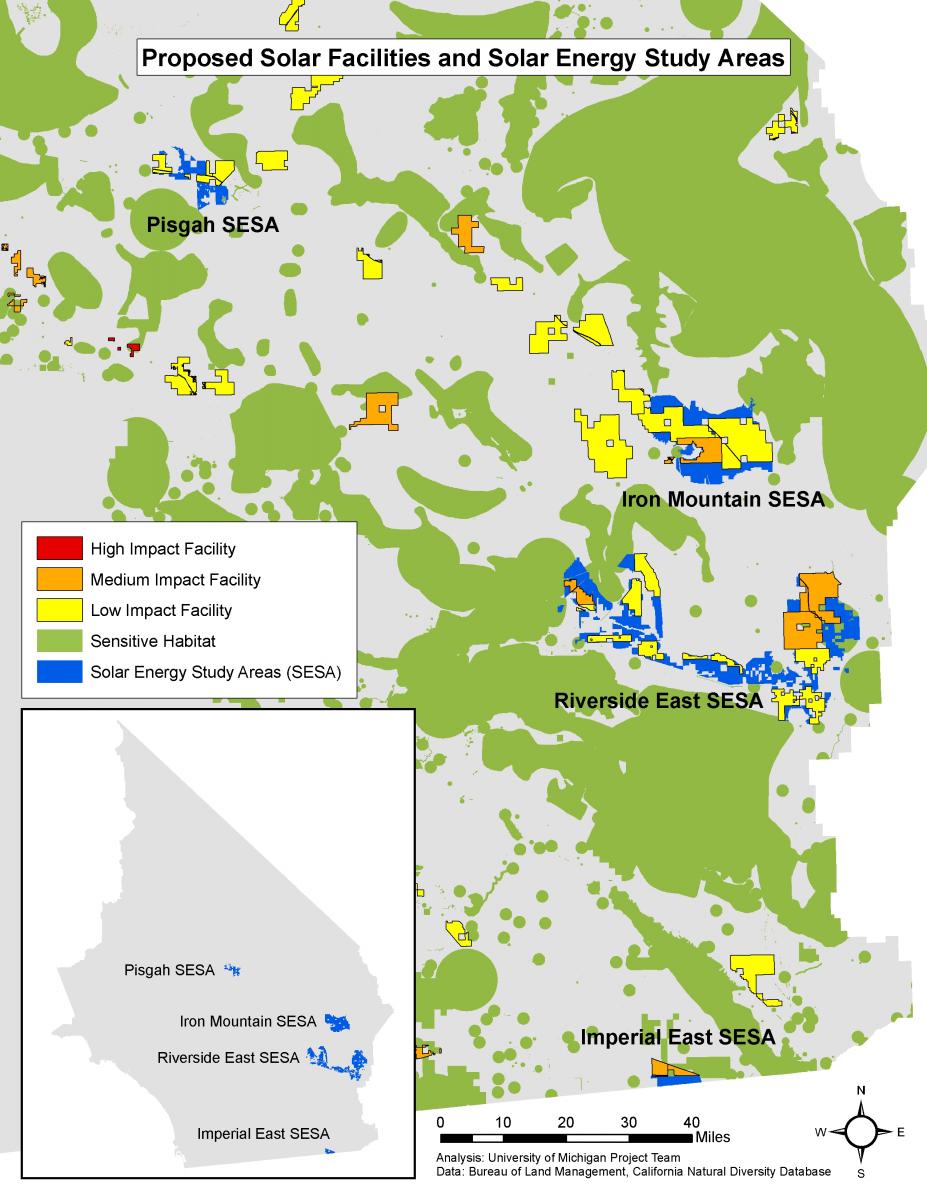
Compared with the Fast Track and All Proposed scenarios, the SESA scenario has the lowest overall ecological impact, with the lowest amount of sensitive habitat within the scenario, the lowest total sensitive habitat impact score, and fewer individual high and medium impact facilities, based on the data used and the assumptions noted. Only 10.86 percent of land proposed for development in the SESA scenario contains sensitive habitat, compared to 12.31 percent for the All Proposed and 18.89 percent for the Fast Track scenarios. In addition, the SESA scenario has the lowest average facility impact score at 11.02, while the Fast Track (19.47) and All Proposed (24.62) scenarios have much higher average facility impact scores. Examining total impact scores for individual facilities, 14 of the SESA facilities are low impact, six are medium impact, and none are high impact. All four of the SESAs avoid major swaths of sensitive habitat and most of the facilities within SESAs are low impact facilities (Map 1).
Based on the data available to us, the SESA scenario will also require the least amount of disturbance to surrounding habitat because its facilities are, in general, closer to existing transmission lines and have lower slope. Concentrating facilities into limited areas like SESAs, may allow facilities to share new or existing transmission lines and reduce the amount of land that would need to be disturbed to connect new facilities to the grid. In our visual impact analysis for the three scenarios, we found that clustering facilities in low elevation areas surrounded by mountains or other high elevation landscape features helped to minimize the extent of impacts to visual resources. The SESA scenario was found to have the lowest visual impact compared to the amount of land actually developed, with a ratio of only 4.87 acres of land that are visually affected for every one acre of land developed, compared to the All Proposed (7.79) and the Fast Track (17.64) scenarios. Clustering of facilities may be crucial to reducing visual impacts of solar development across the landscape.
Based on our ecological and visual impact analyses and associated assumptions, we conclude that the SESA development scenario would have the least impact of the three scenarios. However, further analysis would be needed to determine whether SESAs are the optimal locations for solar development in the California desert. This scenario-based approach would be useful in future evaluations of landscape-level impacts from solar development.