Key Considerations of Developers
Over the course of nine interviews we conducted with industry experts and solar developers, we determined three key items developers consider when selecting a technology: technological maturity, solar resource at the location of the proposed facility, and cost of installation.
- Technology maturity: The level of technological maturity was brought up as a key consideration. The relatively long amount of time that parabolic trough technology has been in operation was mentioned by one solar developer as the primary reason why their company has chosen CSP technology over all others.1 Starting with the SEGS I demonstration project back in 1984 through the 1990s with SEGS II through IX, parabolic trough technology has been generating electricity in the California desert for over 25 years. In contrast, while the original concept of the Stirling engine was conceived in the 1800s, this technology has only been applied to solar power production since Stirling Energy Systems, a Scottsdale, Arizona-based systems and integration management company, began serious development in 1996. Additionally, to date, only a 1.5 MW demonstration Stirling Engine facility has been installed. Similarly, photovoltaic technology has experienced only marginal penetration into the utility-scale power generation market, despite being used for various power generation applications since the 1960s, primarily because solar cell manufacturing costs have been too high. However, with increased utility rates and bolstered manufacturing capability, the photovoltaic industry has experienced tremendous growth over the past 15 years2, which also helps explain why roughly 40 pcent of the applications submitted to the BLM for review use photovoltaic technology.
-
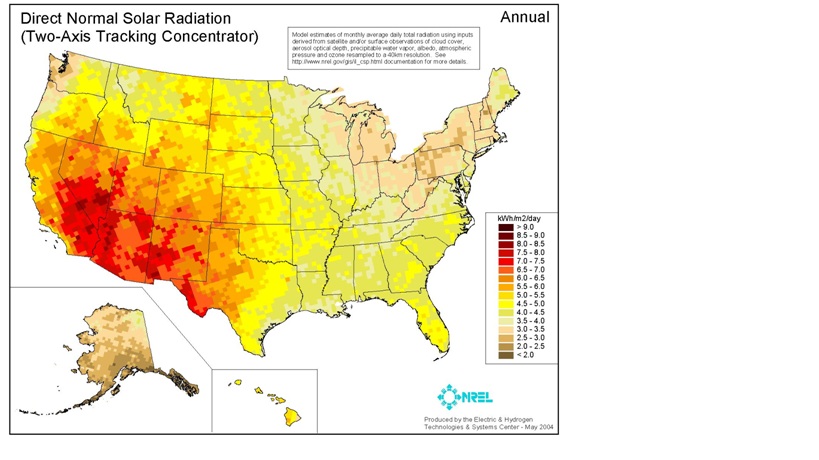
Solar resource: The solar resource at a given location has a direct impact on the power generating capability of any solar technology system. As discussed earlier, the California desert hosts some of the best solar resource in the world; however, it is not evenly distributed across all regions (Map 1). Even within the broader context of the desert region, a 10 percent change in solar resource can occur within a few miles of two different locations.3 Therefore, in order to produce the same amount of electricity, a 10 percent decline in solar resource translates to a 10 percent increase in facility size, which can lead to cost and other impact implications.
-
Cost of installation: And finally, the last key consideration for developers is cost. Table 1 summarizes installed costs for the various technology options currently available for utility-scale solar facilities. Most technologies included in this list cost the same to install; however, dish/engine systems have a noticeably wider cost range and flat plate PV systems have a minimum cost three times higher most other technologies. Using the 13 Applications for Certification (AFC) that are publicly available for viewing as an indicator of developer preference, two projects each call out the use of power tower, dish/engine and thin film PV technology, while the remaining seven use parabolic trough technology (Table 1).
| Technology Type | # of proposed projects | Installed cost ($/W) |
|---|---|---|
| Parabolic Trough | 7 | 3 – 6 4 |
| Power Tower | 2 | 2 - 5 5 |
| Dish/Engine | 2 | 2 – 50 6 |
| Flat plate PV | 0 | 6 - 10 7 |
| Thin Film PV | 2 | 3 - 5 8 |
One factor that is no longer much of a consideration for developers is cooling system type. In September of 2009, the California Energy Commission passed down guidance restricting the use of “wet” cooled systems and mandating the use of “dry” cooled systems for new power generation facilities built in California. However, because applications were submitted prior to the publication of the CEC report, some projects still include plans for the installation of a “wet” cooled system. Therefore, a brief discussion of the tradeoffs related to various cooling system types is warranted. The CEC commissioned an external consultant to research economic, environmental and other tradeoffs. Some of the key findings are summarized in the Table 2.
| Tradeoff | “Wet” | “Dry” | Hybrid – Plume abating | Hybrid – Water conserving |
|---|---|---|---|---|
| Water consumption | 600 to 900 Gal/MWh | ~5 percent of “Wet” | Equal to “Wet” | 20 to 80 percent of “Wet” |
| Capital Cost | BASE | 1.5x to 3x Base | 1.1x to 1.5x Base | 3x to 5x Base |
| Performance Penalty | BASE | 5 to 20 percent capacity loss | Equal to Base | Highly variable |