Results and Analysis
Table 1 displays the results of the viewshed analysis for each scenario. In the Fast Track scenario, almost 900,000 acres of land have a view of at least one solar facility while four facilities is the greatest number of facilities that can be seen at one time; in the SESA scenario, just over 1 million acres of land have a view of at least one solar facility while 13 facilities is the greatest number of facilities that can be seen at one time; in the All Proposed scenario, about 3.6 million acres of land have a view of at least one solar facility, while 16 facilities is the greatest number of facilities that can be seen at one time. To put the number of affected acres into perspective, we provided the percent of the CDCA for each visual footprint, with the CDCA being about 25.6 million acres of land.
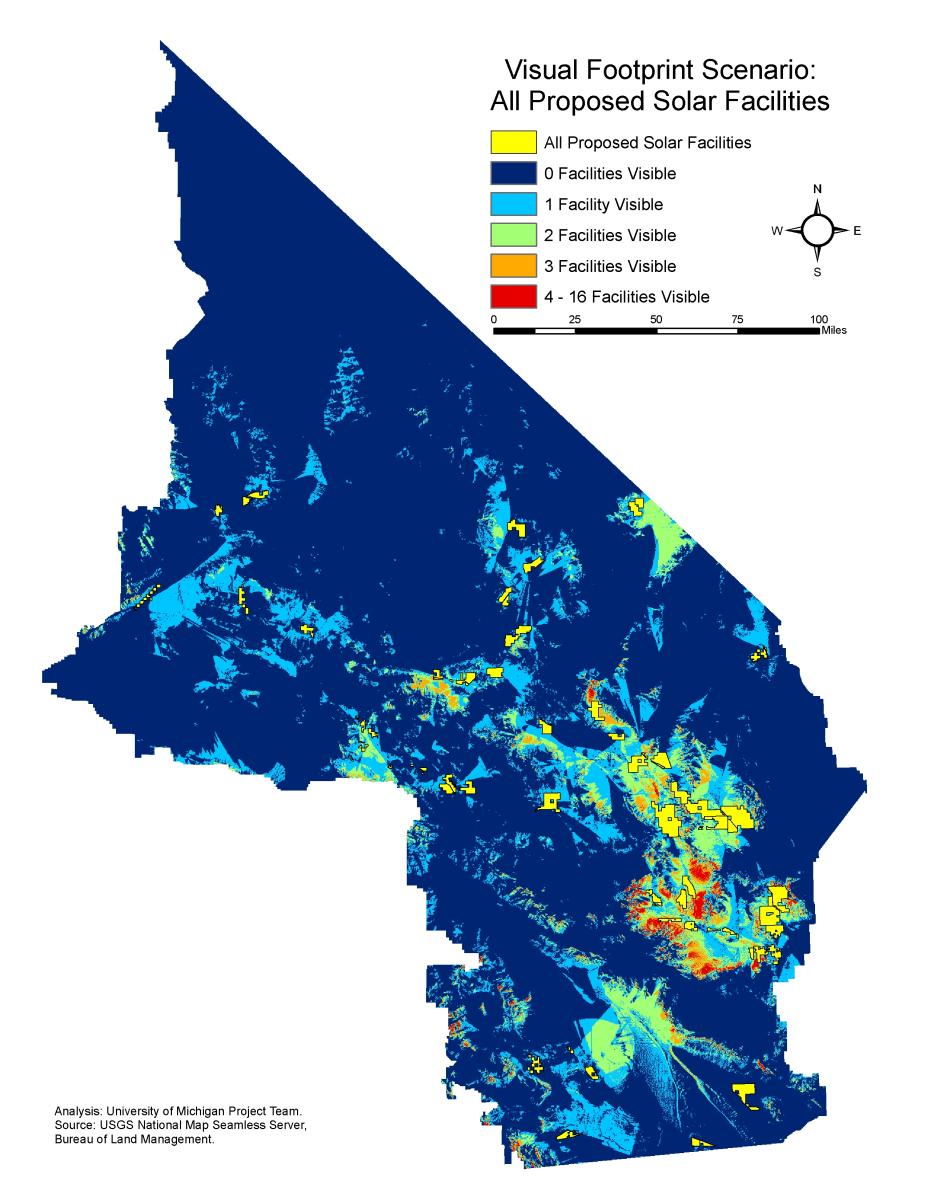
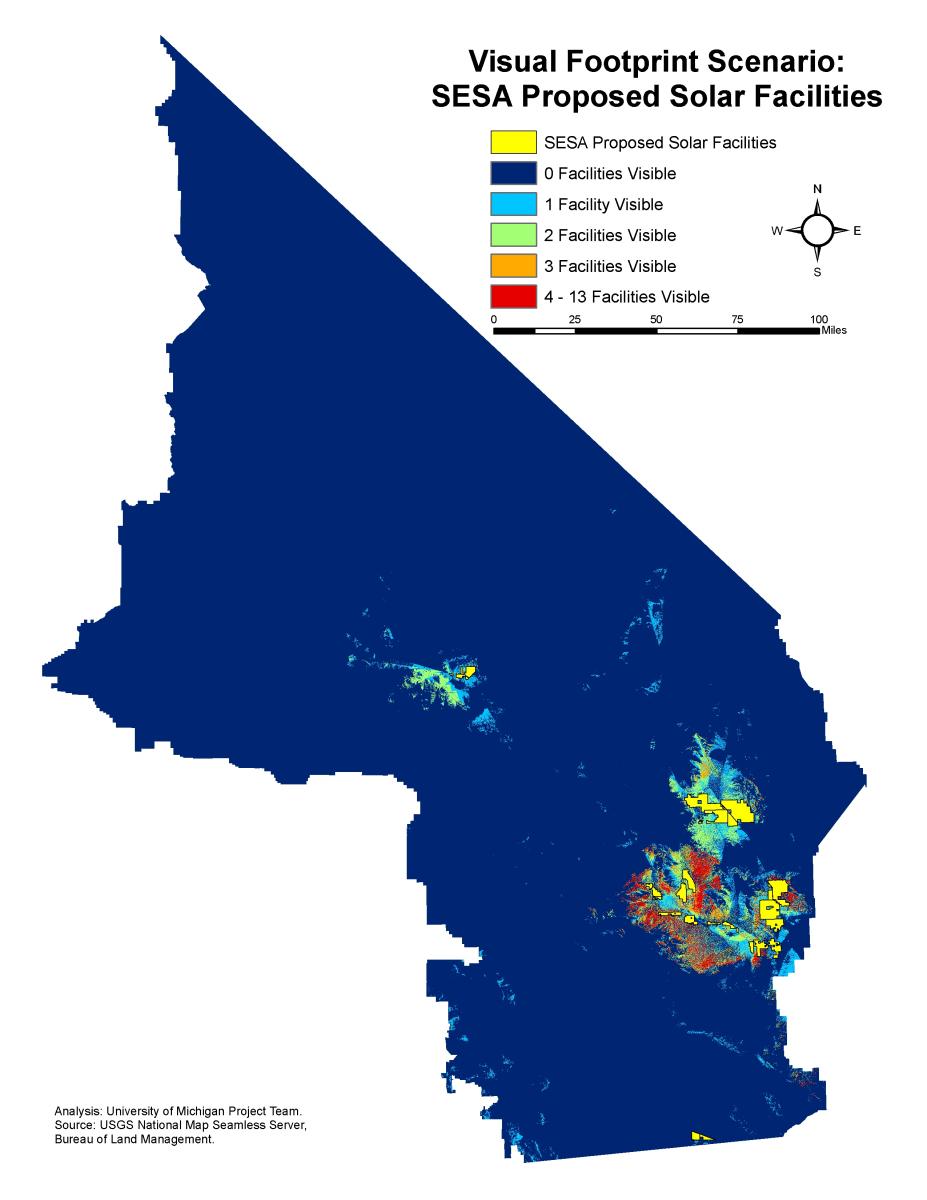
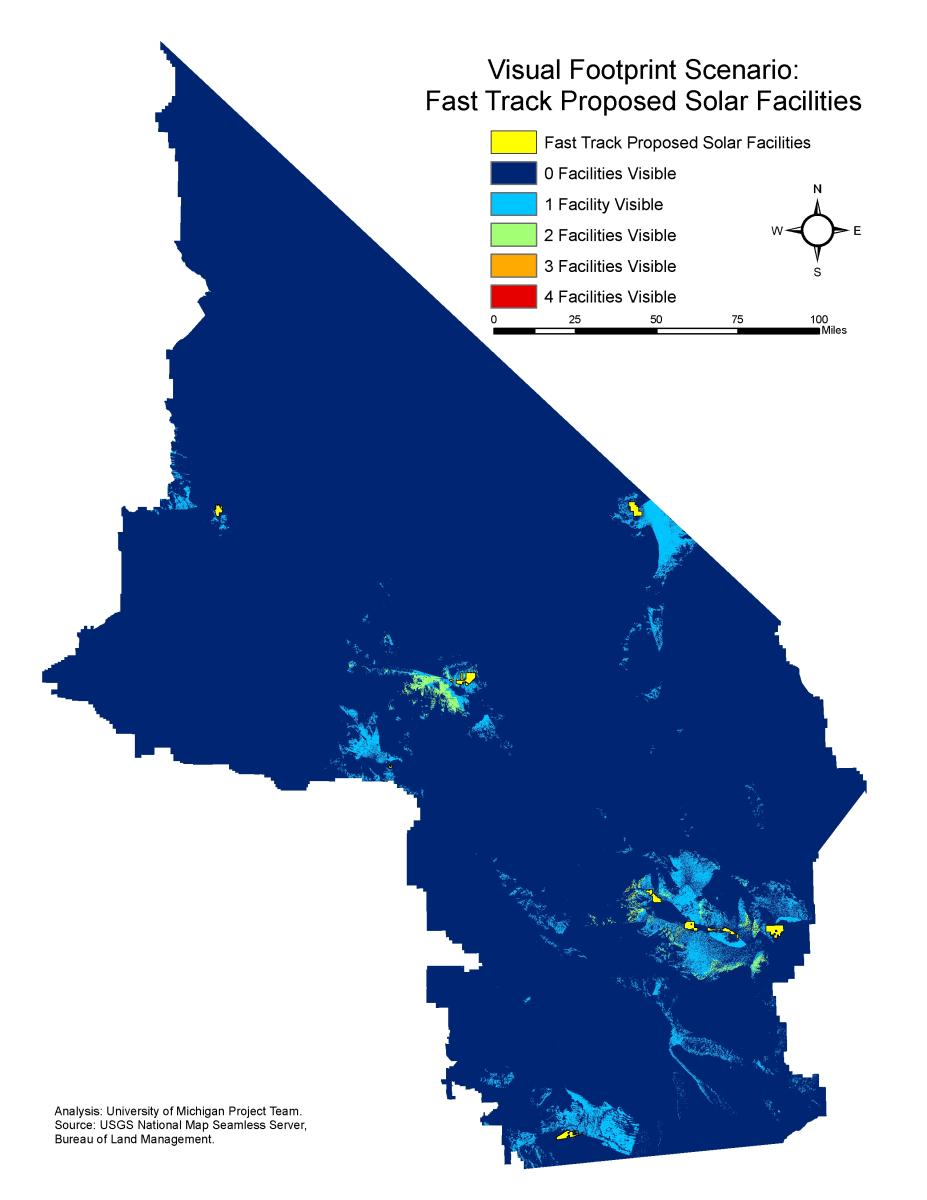
Of the three scenarios, the All Proposed scenario has the largest visual impact (Map 1), with at least one solar facility visible to about 15 percent of the CDCA. The SESA scenario has the second largest impact, with at least one solar facility visible to about 4 percent of the CDCA (Map 2). The Fast Track scenario has the smallest impact, with only about 3.5 percent of the CDCA visually affected by solar facilities (Map 3).
| Fast Track | SESA | All Proposed | ||||
|---|---|---|---|---|---|---|
| Number of Visible Faclities | # of Acres | % of CDCA | # of Acres | % of CDCA | # of Acres | % of CDCA |
| 1 | 802985.0 | 3.133 | 475052.0 | 1.854 | 2473928.0 | 9.654 |
| 2 | 79335.0 | 0.31 | 311426.0 | 1.215 | 884328.0 | 3.451 |
| 3 | 3963.0 | 0.015 | 127346.0 | 0.497 | 292271.0 | 1.141 |
| 4 | 40 | 0 | 65105.0 | 0.254 | 109831.0 | 0.429 |
| 5 | 36722.0 | 0.143 | 47493.0 | 0.185 | ||
| 6 | 12103.0 | 0.047 | 15824.0 | 0.062 | ||
| 7 | 4031.0 | 0.016 | 4898.0 | 0.019 | ||
| 8 | 2006.0 | 0.0080 | 2422.0 | 0.0090 | ||
| 9 | 1148.0 | 0.0040 | 1342.0 | 0.0050 | ||
| 10 | 744 | 0.0030 | 847 | 0.0030 | ||
| 11 | 173 | 0.0010 | 283 | 0.0010 | ||
| 12 | 3 | 0 | 22 | 0 | ||
| 13 | 0.22 | 0 | 9 | 0 | ||
| 14 | 8 | 0 | ||||
| 15 | 4 | 0 | ||||
| 16 | 3 | 0 | ||||
| At Least 1 | 886323.0 | 3.459 | 1035859.0 | 4.042 | 3833512.0 | 14.959 |
The numbers of acres in the table correspond to the number of facilities that are visible from those acres. The total number of visually affected acres for each scenario is calculated by adding up acres for each of the number of visible facility values, seen here as the numbers in the “At Least 1” row.
Since the total number of acres of solar facilities differs across the scenarios, we compared the amount of land developed in each scenario with the size of the scenario’s visual footprint. The total developed acres were calculated for each scenario by adding up the acreage for each proposed facility within that scenario (Table 2). The amount of land where at least one solar facility was visible was considered to be the scenario’s visual footprint. The ratio of visual footprint acres to developed acres was calculated by dividing Visual Footprint acres by Total Developed Acres.
| Total Developed Acres | Visual Footprint | Ratio | |
|---|---|---|---|
| Fast Track | 50252.0 | 886323.0 | 17.64 |
| SESA | 212901.0 | 1035859.0 | 4.87 |
| All Proposed | 491828.0 | 3833512.0 | 7.79 |
The Fast Track scenario has the largest visual footprint ratio, while the SESA scenario has the smallest. There are about 18 acres of visual footprint for every 1 acre of solar development in the Fast Track scenario, about 5 acres of visual footprint for every 1 acre of solar development in the SESA scenario, and about 8 acres of visual footprint for every 1 acre of solar development in the All Proposed scenario.
To understand how individual facilities contribute to the overall scenario footprint ratio, we placed individual facilities into four categories based on the size of the facility’s visual footprint (Table 3).
| Visible Acres (in 1,000s) | Total Number of Facilities | Fast Track | Fast Track and SESA | SESA | Other |
|---|---|---|---|---|---|
| Less than 50 | 10 | 1 | 1 | 2 | 6 |
| 50 to 100 | 18 | 1 | 3 | 5 | 9 |
| 100 to 150 | 13 | 1 | 0 | 7 | 5 |
| 150 to 600 | 12 | 1 | 2 | 1 | 8 |
The majority of individual facilities, 43, affect fewer than 150,000 acres. Surprisingly, many SESA facilities were present in the higher impact categories: three facilities in the 150,000 to 600,000 acre category, seven facilities in the 100,000 to 150,000 acre category, and eight facilities in the 50,000 to 100,000 acre category. However, if visual footprints for multiple facilities overlap within a scenario, the number of acres that are visually affected by at least one facility will remain constant. Overlapping visual footprints likely contributes to the low visual footprint to developed acres ratio in the SESA scenario. It makes sense that the SESA scenario has the smallest visual footprint ratio because SESAs are meant to cluster facilities, which reduces the overall area by which they can be seen.
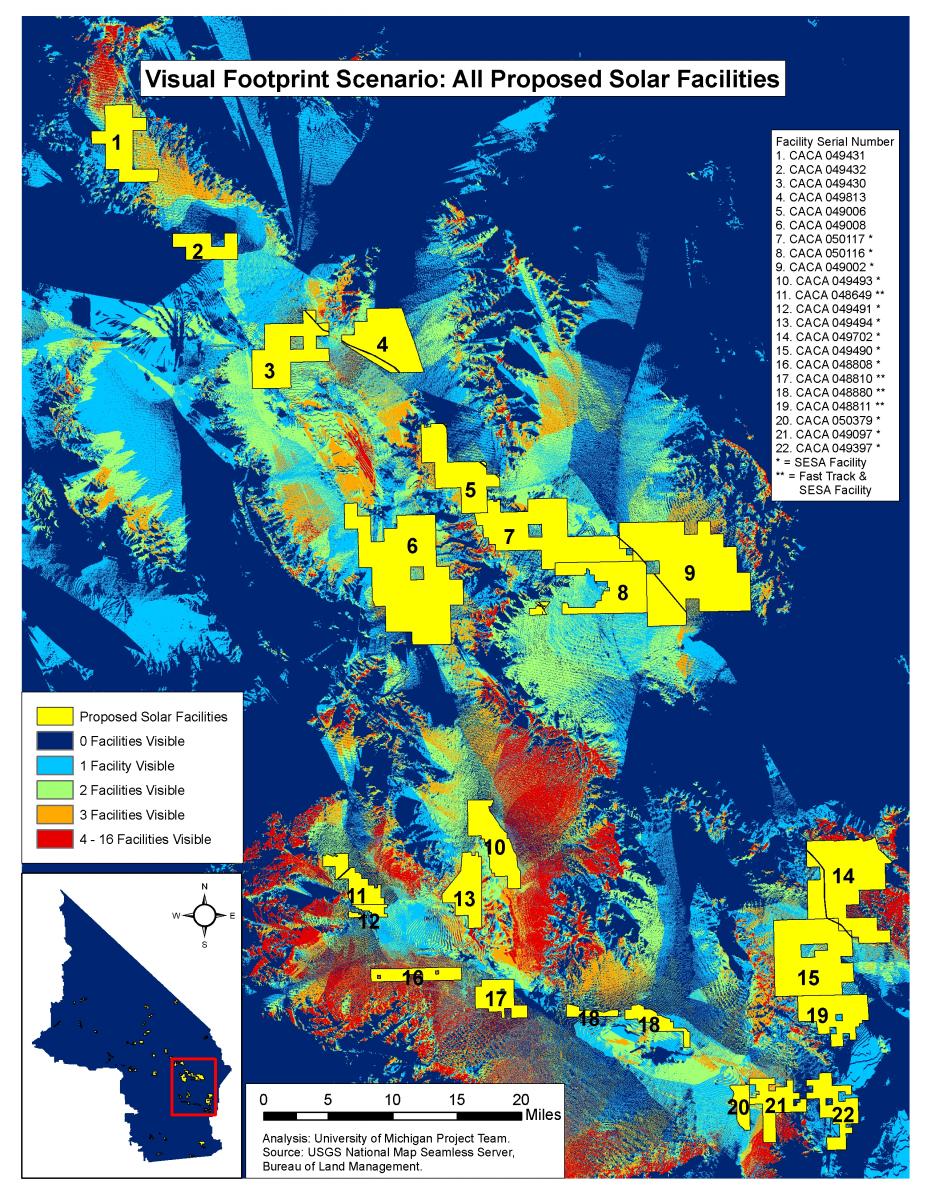
If we examine the viewshed of several solar facilities more closely, we see how factors like clustering play a role in determining the magnitude and extent of impact to visual resources (Map 4). Impacts to visual resources are high in and around clusters of facilities and then dissipate as distance from the cluster of facilities increases (Map 2). Elevation plays a major role in determining the extent of facility visibility. A greater number of facilities are visible to higher elevation areas, such as mountaintops, and therefore views of the desert landscape from those areas are more heavily affected. However, higher elevation areas may also play a role in containing the visual impact of a facility because facilities are usually situated in low slope and low elevation areas. For example, facilities labeled 10 to 13, 16, and 17 in Map 4 are surrounded by higher elevations. The mountaintops surrounding these facilities sustain high impacts to visual resources and are denoted in red, indicating that four to 16 facilities may be seen from those areas. However, beyond these higher elevation areas (such as the northeast), the facilities are no longer visible. Facilities that are not bordered by higher elevation areas, including facilities one to nine, have a much wider area of impact. The extent of visual impacts in the SESA scenario are smaller and more concentrated (Map 2) than visual impacts in the Fast Track scenario (Map 3), despite a higher number of facilities in the SESA scenario. Thus, if land managers were interested in minimizing the visual impact of utility-scale solar development across the California desert landscape, siting facilities in SESAs or similarly clustered developments might be the most effective way to accomplish such a goal. Restricting visual impacts to a smaller area may also be accomplished by siting developments in lower elevation areas surrounded by mountains or other high-elevation landscape features.