Results
Distance to Transmission
The minimum distance of a facility to the nearest transmission line ranges from zero meters (indicating that the facility is proposed to overlap an existing line) to 36,707 meters, or about 23 miles (Map 1). Looking at the average minimum distance to transmission for each scenario, the SESA scenario has the smallest average minimum distance at 1,558 meters, while the All Proposed scenario has the largest at 5,496 meters (Table 1). Table 1 also lists the minimum and maximum distances in our minimum distance to transmission calculation. The Fast Track scenario falls in the middle at 2,694 meters. Because some existing transmission lines are absent from the data used for this analysis, it is possible that some proposed facilities may be closer to transmission lines than our results suggest.
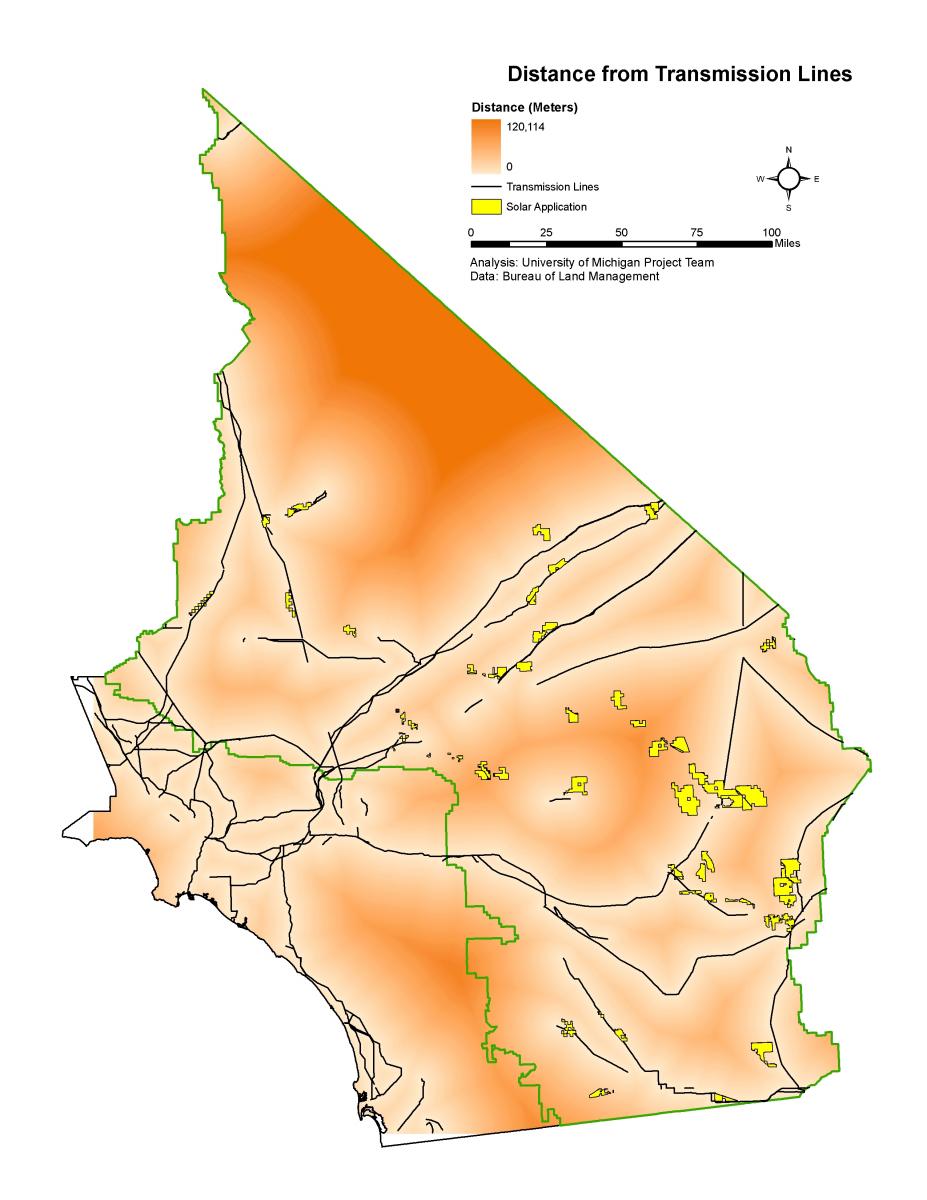
| Average Minimum Distance | Minimum Minimum Distance | Maximum Minimum Distance | |
|---|---|---|---|
| Fast Track | 2694.0 | 0 | 12098.0 |
| SESA | 1558.0 | 0 | 6936.0 |
| All Proposed | 5966.0 | 0 | 36707.0 |
Because one of the criteria for SESA locations was proximity to transmission, it makes sense that the SESA scenario has the lowest average distance to existing transmission lines. To understand how individual facilities contribute to the overall scenario, we placed individual facilities into four categories based on the minimum distance to transmission (Table 2).
| Minimum Distance to Transmission (in meters) | Total Number of Facilities | Fast Track | Fast Track and SESA | SESA | Other |
|---|---|---|---|---|---|
| 0 | 24 | 2 | 4 | 8 | 10 |
| 1 to 5,000 | 11 | 0 | 2 | 4 | 5 |
| 5,000 to 10,000 | 7 | 1 | 0 | 2 | 4 |
| 10,000 to 20,000 | 6 | 1 | 0 | 0 | 5 |
| Greater than 20,000 | 4 | 0 | 0 | 0 | 4 |
While one of the Fast Track facilities and nine of the All Proposed scenario facilities are over 10,000 meters from existing transmission lines, all SESA facilities are within 10,000 meters of existing transmission lines. Twelve of the 20 SESA facilities are directly on existing transmission lines.
Percent Slope
The California desert contains a range of percent slope (Map 2). The average percent slope of a facility ranges from one percent to 51 percent. Looking at the mean of the average percent slope for each scenario, the SESA scenario has the smallest mean average percent slope at 13.75 percent, while the All Proposed scenario has the largest at 17.68 percent (Table 3). The Fast Track scenario falls in the middle at 14.75 percent.
| Average | Lowest | Highest | |
|---|---|---|---|
| Fast Track | 14.75 | 2 | 44 |
| SESA | 13.75 | 1 | 51 |
| All Proposed | 17.68 | 1 | 51 |
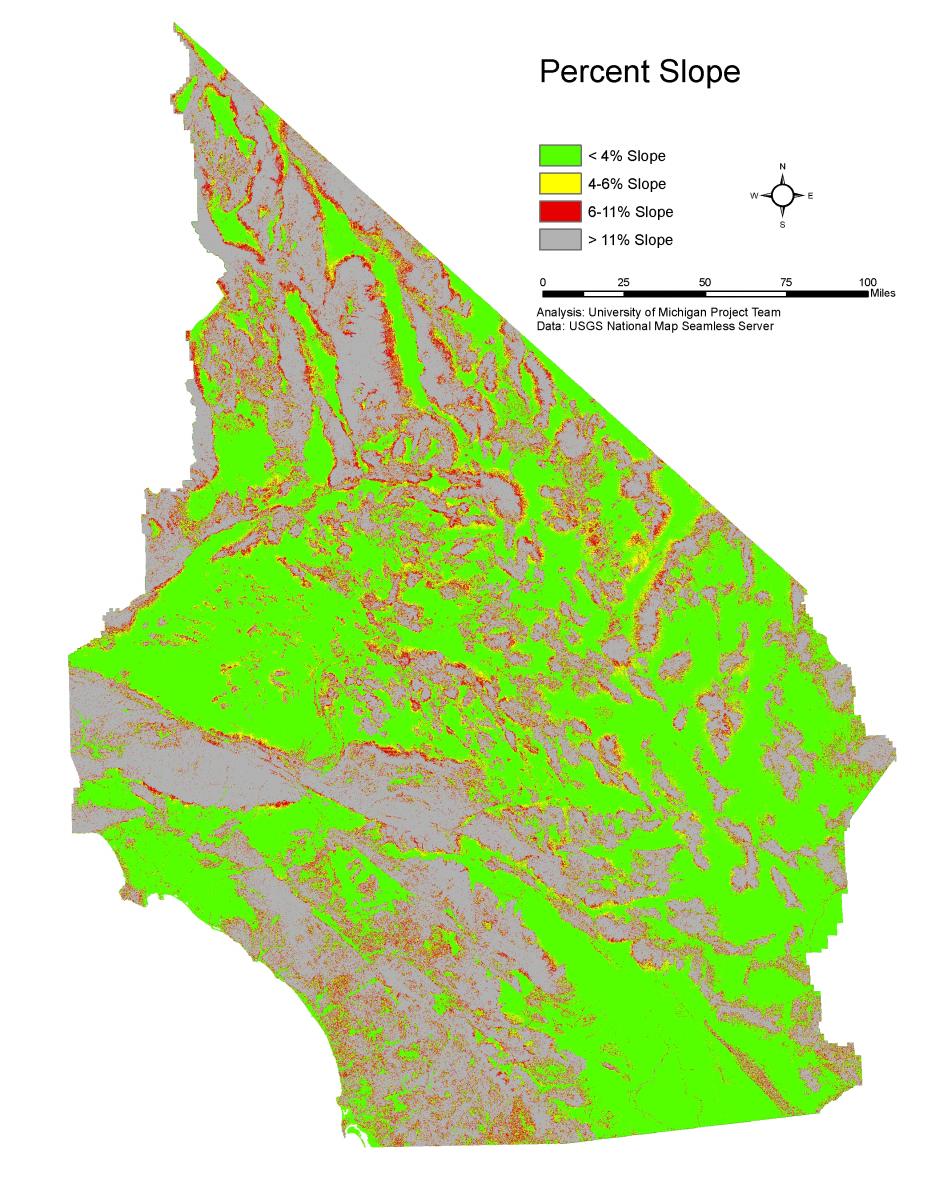
Because one of the selection criteria for SESA locations was relatively low slope, it makes sense that the SESA scenario has the lowest average slope. To understand how individual facilities contribute to the overall scenario, we placed individual facilities into four categories based on average percent slope (Table 4).
| Average Percent Slope | Total Number of Facilities | Fast Track | Fast Track and SESA | SESA | Other |
|---|---|---|---|---|---|
| 1 to 6 | 18 | 1 | 3 | 7 | 7 |
| 6 to 11 | 9 | 1 | 2 | 2 | 4 |
| 12 to 40 | 18 | 2 | 1 | 2 | 13 |
| Greater than 40 | 7 | 0 | 0 | 3 | 4 |
Over half of the Fast Track facilities (seven of the 10) and SESA facilities (14 of the 20) have an average slope below 11 percent. However, of all 52 facilities, about half have an average slope below 11 percent and about half have a slope above 11 percent, contributing to the higher mean average percent slope for the All Proposed scenario.