Water Use Efficiency
The impacts to groundwater and surface water availability from solar development will vary by project, and will depend on amount of water used as well as water source. Water obtained by surface water diversion and groundwater pumping can have implications for desert ecosystems. However, California desert hydrology is complex, and impacts to water levels are sometimes difficult to predict. Due to the limited amount of water resources in the California desert, the issue of water use by utility-scale solar energy facilities is highly contentious in the views of environmentalists, communities, developers, politicians, and land managers.
Total Water Use Per Project
In order to investigate the impact of the various projects on water resources, an analysis was conducted based on information gathered from the publicly available AFC for each project (Table 1). On a project-by-project basis, a clear comparison can be made based on absolute water consumption among the various technology types (Table 1 and Figure 1).
| Project | Cooling system type | Annual H2O usage (AFY) | |
|---|---|---|---|
| Solar Millennium - Blythe | Parabolic Trough | Dry | 600 |
| Solar Millennium - Ridgecrest | Parabolic Trough | Dry | 150 |
| Solar Millennium - Palen | Parabolic Trough | Dry | 300 |
| Parabolic Trough Average | 350 | ||
| Beacon Solar Energy Project | Parabolic Trough | Wet | 1600.0 |
| Abengoa Mojave | Parabolic Trough | Wet | 1077.0 |
| Genesis Solar | Parabolic Trough | Wet | 1644.0 |
| Parabolic Trough Average | 1440.0 | ||
| Ivanpah | Power Tower | Dry | 100 |
| Rice Solar Energy Project | Power Tower | Dry | 150 |
| Power Tower Average | 125 | ||
| Calico (formerly Solar One) | Stirling Engine | N/A | 36 |
| Imperial Valley (formerly Solar Two) | Stirling Engine | N/A | 33 |
| Stirling Engine Average | 35 | ||
| Chevron Lucerne Valley | Thin-Film PV | N/A | 0.142 |
Notes: “N/A” stands for not applicable in this table. [1] "Large Solar Energy Projects." California Energy Commission Home Page. Web. 20 Mar. 2010. <http://www.energy.ca.gov/siting/solar/index.html>
On an absolute scale, thin film photovoltaic facilities appear to consume much less water than other solar thermal based technologies. This is mainly because the water that is used during operation of these types of facilities is only for washing the modules and is not needed as part of the electricity generation process. It should be noted, however, that the water use value for thin film PV technology in this study is based on only one project and the size of the facility is approximately one fifth the size of an average parabolic trough system. Therefore, for a more accurate comparison, the amount of water used by the thin film PV facility would need to be increased by five times. Yet, even with a five- fold increase, the absolute consumption of water by thin film PV systems is still the lowest of all the technologies analyzed. In contrast, in terms of total annual water consumption, wet-cooled parabolic trough systems are clearly the most water-intensive technology type, consuming an average of close to 1.9 million gallons of water per megawatt of installed capacity.
Water Use Efficiency
Total water consumption is often used as a metric to measure impact on water resources; however, these values do not accurately represent how efficiently the various technology types use water. In order to quantify this efficiency, a separate analysis was conducted using the water consumption values in conjunction with each project’s electricity generation capability, similar to the land use efficiency analysis above. The analysis was based on average annual water consumption rates and average annual electricity production of each facility. The total electricity production value (in MWh) was chosen over the nameplate capacity (in MW) of the facility because it inherently takes into consideration the operating efficiencies of various solar technology types and is a more accurate representation of the facilities’ power producing capabilities.
Based on this analysis, it was determined that on a per MWh basis, thin film PV facilities actually appear to be the least water efficient technology with an average efficiency of 6,912 gallons of water used per MWh of electricity produced (Table 2). In contrast, dish/engine systems appear to be the most water efficient technology type, requiring only an average of four gallons of water consumed per MWh of electricity produced. In other words, a thin film PV facility would use approximately 1,700 times more water than a dish/engine facility to produce the same megawatt of electricity. This was a surprising result since PV facilities have the lowest overall water consumption due to the fact that they do not utilize cooling systems and the only water used during operation is attributed to washing the modules. Upon further investigation, it was determined that the reason why thin film PV facilities appear so unfavorable in this analysis is because of the low module efficiency of this type of technology. This leads to two important consequences that affect the analysis. First, the low module efficiency effectively lowers the overall operating efficiency of the facility, thereby reducing the total
| Project | Cooling system type | Water consumption per unit of electricity produced (Gallons/MWh) | |
|---|---|---|---|
| Solar Millennium – Blythe | Parabolic Trough | Dry | 93 |
| Solar Millennium – Ridgecrest | Parabolic Trough | Dry | 98 |
| Solar Millennium – Palen | Parabolic Trough | Dry | 98 |
| Parabolic Trough Average | 96 | ||
| Beacon Solar Energy Project | Parabolic Trough | Wet | 869 |
| Abengoa Mojave | Parabolic Trough | Wet | 557 |
| Genesis Solar | Parabolic Trough | Wet | 1786.0 |
| Parabolic Trough Average | 1071.0 | ||
| Ivanpah | Power Tower | Dry | 34 |
| Rice Solar Energy Project | Power Tower | Dry | 109 |
| Power Tower Average | 71.52 | ||
| Calico (formerly Solar One) | Stirling Engine | N/A | 3.94 |
| Imperial Valley (formerly Solar Two) | Stirling Engine | N/A | 4.1 |
| Stirling Engine Average | 4.02 | ||
| Chevron Lucerne Valley | Thin Film | N/A | 69124 |
amount of electricity produced. Second, because less power is produced per unit area, installation of
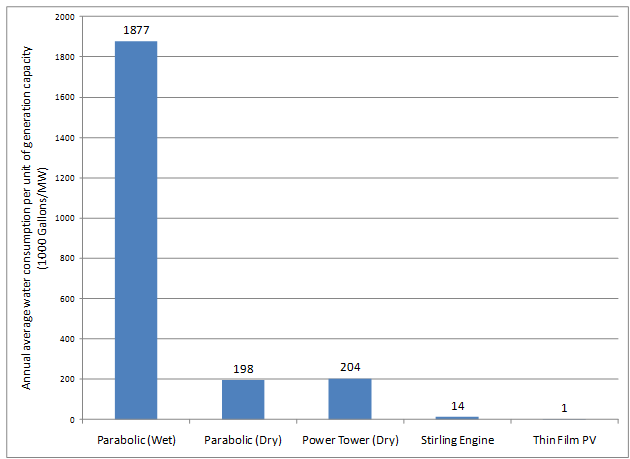
more solar modules would be necessary to produce a fixed amount of electricity. As a result of this increase of installed units, more water would be necessary to clean these additional modules. For comparison, water efficiency rates among various solar and conventional power plant types such as coal, natural gas or nuclear is shown in Figure 2.
It should be noted that PV technology companies are continuously working on improving water capture and reuse methods as well as developing systems that would not require module washing. Advances in this area would greatly improve the water use efficiency values of these systems and should be monitored and analyzed on an ongoing basis.
![Figure 2. Comparison of water consumption efficiency rates. Source: Water & Sustainability (Volume 3).[4]](/drupal/recd/sites/webservices.itcs.umich.edu.drupal.recd/files/Figure6-4_0.jpg)