Results
General Habitat Impacts
With our first analysis, we were interested in the number of facilities that would have an effect on sensitive habitat and how much sensitive habitat would be affected by individual facilities. We compared the area of land within a facility that had a score of zero (indicating the absence of sensitive habitat) to the area within a facility that had a score greater than zero (indicating the presence of rare or endangered species habitat). If all of the land within a facility had a score of zero, the facility would not affect sensitive habitat, while scores other than zero within the facility boundary indicated that the facility would affect sensitive habitat. Of the 52 proposed facilities, we found that 31 of the facilities affected sensitive habitat, while 21 of the facilities had no effect on sensitive habitat (Table 1). The amount of sensitive habitat for each facility ranged from zero percent of the facility (no sensitive habitat was contained by that facility) to 100 percent (the entire facility area contained sensitive habitat). Table 1 lists the percent of sensitive habitat within a facility and the number of facilities that contain that proportion of habitat.
| Percent of Sensitive Habitat | Number of Facilities |
|---|---|
| 0 | 21 |
| >0 to 10 | 12 |
| >10 to 20 | 5 |
| >20 to 30 | 4 |
| >30 to 40 | 3 |
| >40 to 60 | 0 |
| >60 to 80 | 2 |
| >80 to 100 | 5 |
Of the 52 facilities, 21 of the facilities contained no sensitive habitat. For 12 facilities, 10 percent or less of the facility area contained sensitive habitat. For 12 facilities, 11 to 40 percent of the facility area contained sensitive habitat. For 7 facilities, over 60 percent of the facility area contained sensitive habitat.
We also examined the amount of sensitive habitat that would be affected by each of the three solar development scenarios relative to the total number of acres that would be developed in each scenario. Acres of sensitive habitat were added up for each scenario to give a total number of sensitive habitat acres affected (Table 2). Acres of sensitive habitat were divided by the total number of developed acres to determine percent of sensitive habitat affected by each scenario.
| Acres of Sensitive Habitat | Total Facility Acres | Percent of Sensitive Habitat | |
|---|---|---|---|
| Fast Track | 9338.0 | 49442.0 | 18.89 |
| SESA | 20303.0 | 187025.0 | 10.86 |
| All Proposed | 56871.0 | 461990.0 | 12.31 |
Of the three scenarios, the Fast Track scenario had the largest relative impact, with sensitive habitat occupying 18.89 percent of land in the scenario. The All Proposed scenario had the second largest relative impact with sensitive habitat occupying 12.31 percent of land in the scenario, and the SESA scenario had the smallest relative impact with sensitive habitat occupying 10.86 percent of land in the scenario (Table 2). However, it is important to note that the amount of sensitive habitat found within a facility site may depend on whether or not the proposed site has been surveyed for biological resources, when the site was surveyed, and for what species. Our results must be understood in the context of the data limitations we discussed earlier in this chapter.
Individual Facilities: Average Impacts
Next we compared the average impact of individual facilities. We calculated the weighted average of the scores within each proposed facility using the score and the number of acres occupied by that score. This resulted in five weighted averages for each facility. As an example, weighted averages for one facility are shown in Table 3.
| Classification System | Score | Number of acres | Weighted Average |
|---|---|---|---|
| GRank | 0 | 8290.48 | 5.31 |
| 30 | 1760.44 | ||
| 33 | 20.68 | ||
| SRank | 0 | 8290.48 | 4.41 |
| 20 | 20.68 | ||
| 25 | 1760.44 | ||
| ESA | 0 | 8311.16 | 8.74 |
| 50 | 1760.44 | ||
| CESA | 0 | 8311.16 | 7.87 |
| 45 | 1760.44 | ||
| CNPS | 0 | 45780 | 0 |
| TOTAL Facility Impact (Sum of Weighted Averages) | -- | -- | 26.33 |
The five weighted averages were added together to arrive at a total impact score for each facility. In Table 3, the total impact of facility CACA 049431 on sensitive habitat was calculated to be 26.33. We used the sum of the five weighted averages for each classification system to reach a total facility impact score as the five classification systems provide different information on the rarity or endangerment of a particular species, and thus how sensitive the species would be to habitat disturbance. The total impact score was calculated for all proposed solar facilities and each facility was placed into one of three categories (Table 4). Facilities with total facility impact scores of zero to 10 were categorized as “low impact” facilities, facilities with scores of greater than 10 to 60 were categorized as “medium impact” facilities, and facilities with scores greater than 60 were categorized as “high impact” facilities. The scores 10 and 60 were chosen as cutoff points because 10 is the value at which a species reaches some level of rarity or endangerment in four of the five classifications systems, and 60 is the highest value that an individual species can receive.
| Category | Score Range | # of Facilities | # of Fast Track | # of Fast Track / SESA | # of SESA | Other |
|---|---|---|---|---|---|---|
| Low | 0 to 10 | 34 | 2 | 5 | 9 | 18 |
| Medium | >10 to 60 | 12 | 1 | 1 | 5 | 5 |
| High | >60 | 6 | 1 | 0 | 0 | 5 |
| Note: some facilities are in both the Fast Track and SESA scenarios and are labeled as “Fast Track/SESA” in this table. |
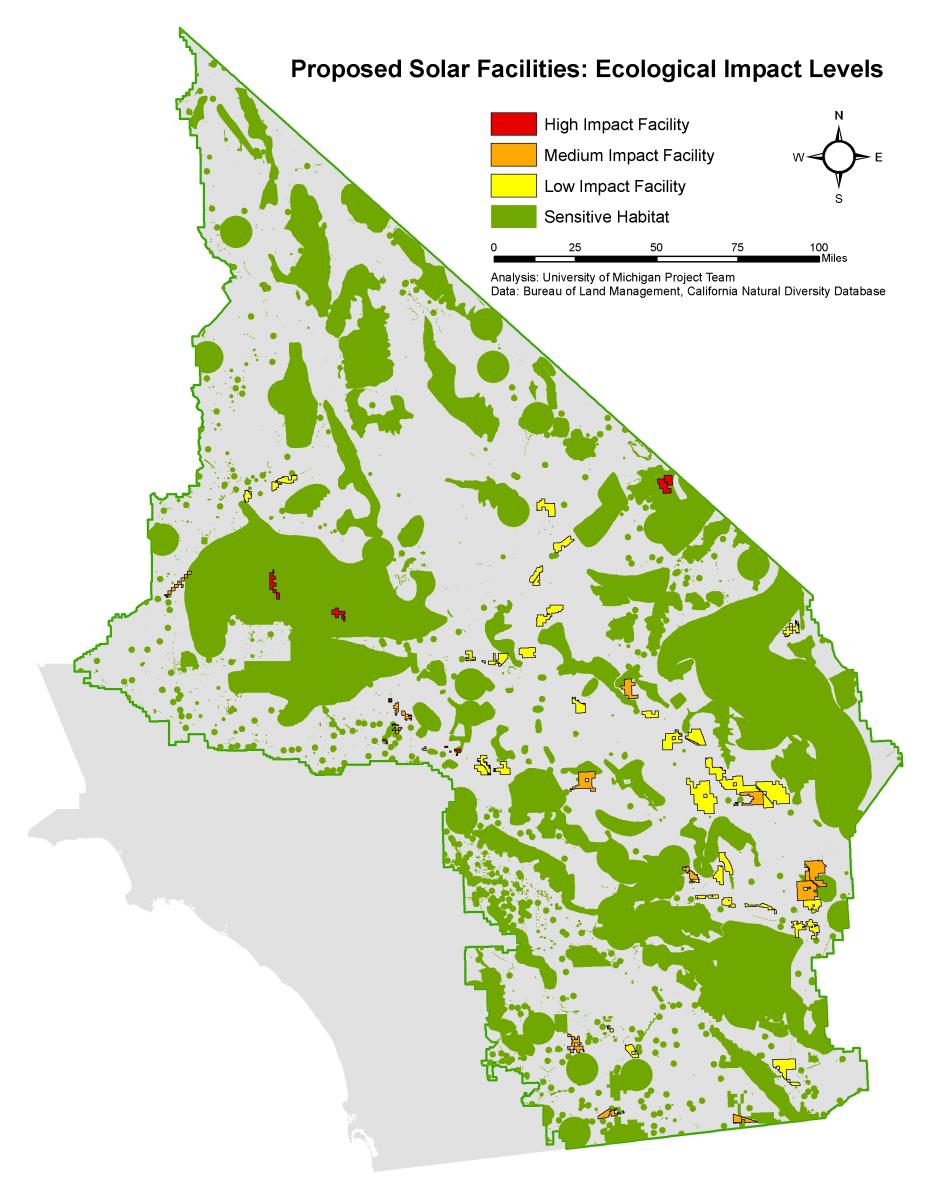
Of the 52 facilities, 34 were categorized as low impact facilities, 12 were categorized as medium impact facilities, and 6 were categorized as high impact facilities. Most facilities in either the Fast Track or SESA scenario fall into the low impact category, though one Fast Track facility (CACA 048668) falls into the high impact category. A complete list of facility total impact scores can be found in Appendix E7. The spatial arrangement of these facilities across the California desert landscape is shown in Map 1.
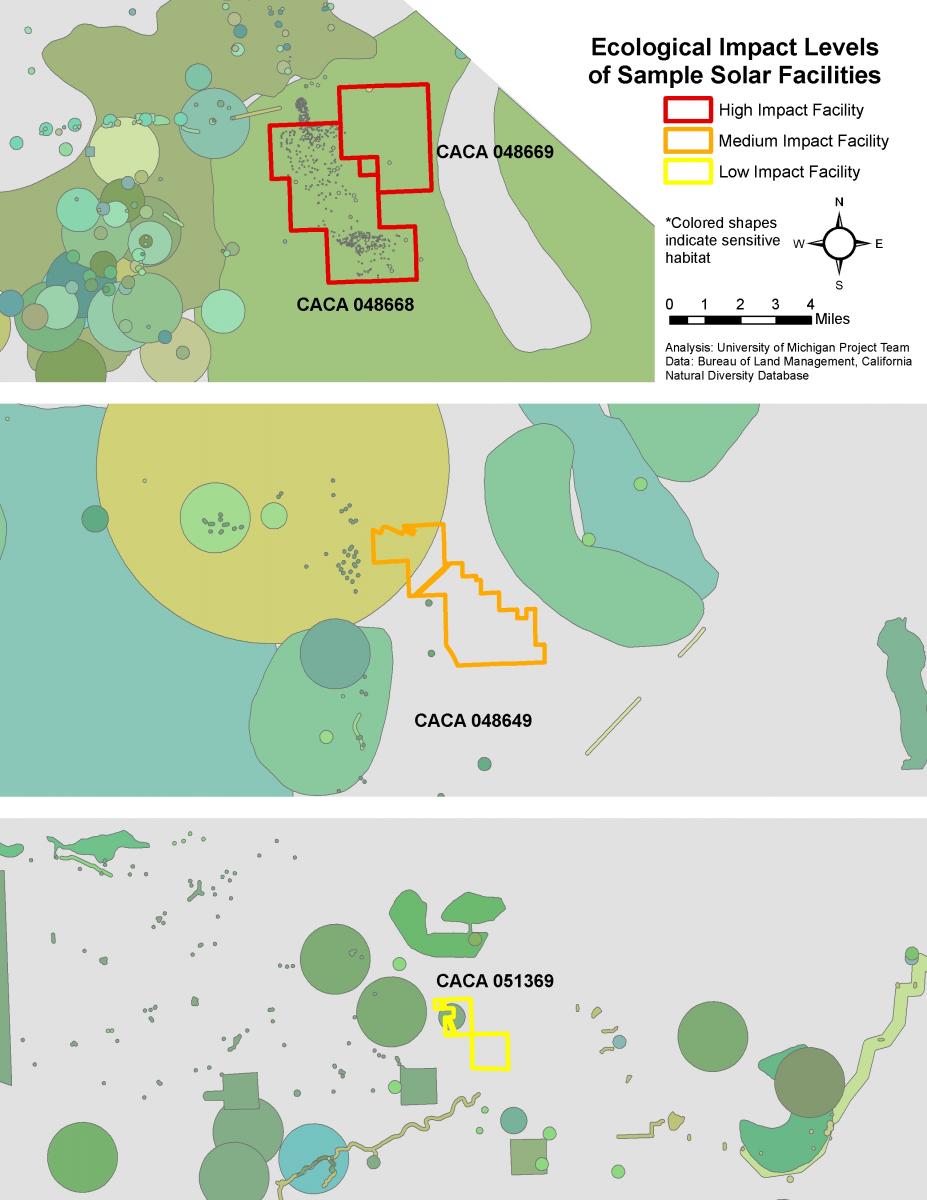
Map 2 zooms in on facilities in each of the impact categories to provide a better sense of why facilities received certain scores. For the two high impact facilities at the top of the map, high scores resulted from complete overlap with one species’ habitat. In addition, facility CACA 048668 is situated over numerous smaller species occurrences. In the middle and bottom frame, less than half of the medium and low impact facilities overlap with species habitat, and so these facilities received lower scores. New off-site roads and transmission lines were not factored into the sensitive habitat analysis, but would also have an impact on the habitat surrounding the facilities. The high impact facility, and to some extent the medium impact facility, in Map 2 are surrounded by sensitive habitat, and construction of new roads or transmission lines would likely have negative effects on those habitats as well.
Individual Facilities: A Closer Look at High Impact Facilities
A few facilities stood out as having higher impacts to sensitive habitat in both the analysis of the percent of sensitive habitat within a facility and in the analysis of average facility impacts. To better understand the negative ecological impacts of high impact facilities, the three facilities with the highest total impact scores were chosen. Relative to facilities in the All Proposed or Fast Track scenarios, the SESA facilities had lower total impact scores and lower percentages of sensitive habitat within the facilities. The SESA facility in Table 5 is used to highlight the contrast between the highest impact Fast Track and non-Fast Track/non-SESA facilities. The SESA facility was selected as an example because it had the highest percentage of sensitive habitat within the proposed facility site and one of the highest total impact scores of all the SESA facilities.
| Identification Number | Facility Status | Percent of the Facility that is Sensitive Habitat | Facility Total Impact Score |
|---|---|---|---|
| CACA 050528 | None | 92 | 179 |
| CACA 048668 | Fast Track | 100 | 155 |
| CACA 050103 | None | 100 | 153 |
| CACA 050174 | SESA | 62 | 41 |
Of all the proposed facilities, CACA 050528 had the highest total impact score, with a score of 179, followed by CACA 048668 (score of 155), and CACA 050103 (score of 153). These scores were significantly higher than the scores of the majority of facilities, as six facilities have total impact scores above 90 (CACA 050528, 048668, 050103, 049017, 048669, 050150), with the next highest impact score falling to 52 (CACA 048728, CACA 049490) (Appendix E7). Sensitive habitat that could be affected by these four facilities is shown in Table 6.
| Identification Number | Affected Sensitive Habitat (By Species) |
|---|---|
| CACA 050528 | •Purple-Nerve Cymopterus (Cymopterus multinervatus) •Prairie Falcon (Falco mexicanus) |
| CACA 048668* | •Desert Pincushion (Coryphantha chlorantha)•Desert Tortoise (Gopherus agassizii)•Mojave Milkweed (Asclepias nyctaginifolia)•Nine-Awned Pappus Grass (Ennaepogon desvauxii)•Parish’s Club-Cholla (Grusonia parishii)•Rusby’s Desert Mallow (Sphaeralcea rusbyi var. eremicola)•Small-Flowered Androstephium (Androstephium breviflorum) |
| CACA 050103 | •Burrowing Owl (Athene cunicularia)•Desert Tortoise (Gopherus agassizii)•Western Snowy Plover (Charadrius alexandrinus nivosus) |
| CACA 050174** | •Flat-tailed Horned Lizard (Phrynosoma mcallii)•Yuma Clapper Rail (Rallus longirostris yumanensis) |
| * = Fast Track Facility | |
| ** = SESA Facility |
The four facilities either completely overlap sensitive habitat (CACA 048668, CACA 050103), or almost completely overlap sensitive habitat (CACA 050528, CACA 050174) of rare and endangered species. The facility with the highest total impact score, CACA 050528, almost completely overlaps both purple-nerve cymopterus (Cymopterus multinervatus) and prairie falcon (Falco mexicanus) habitat. The Fast Track facility, CACA 048668, completely overlaps desert tortoise (Gopherus agassizii) habitat, as well as sensitive habitat for six different rare plant species. CACA 050103 completely overlaps desert tortoise (G. agassizii) habitat, and partially overlaps the habitat of the other two species. The SESA facility, CACA 050174, partially overlaps flat-tailed horned lizard (Phrynosoma mcallii) habitat and only slightly overlaps Yuma clapper rail (Rallus longirostris yumanensis) habitat.
Due to the effect that CACA 050528, CACA 048668, and CACA 050103 are likely to have on sensitive habitat, we encourage the BLM to fully analyze the possible ecological impacts of these and other high impact facilities. We are especially concerned about CACA 048668 because it is a Fast Track facility slated to be permitted and break ground before December 31, 2010 and we encourage the BLM to reconsider this proposed facility.
Development Scenarios: Average Impacts
Next we compared the average impact of each development scenario. Initially, we examined each classification system separately. Using the Fast Track scenario as an example, we took the mean of GRank weighted averages for all the Fast Track facilities by treating each facility as one unit (Table 7). The overall GRank score for the Fast Track facilities is 4.61.
| Fast Track | Weighted Average |
|---|---|
| CACA 047740 | 8.27 |
| CACA 049539 | 1.67 |
| CACA 048668 | 31.58 |
| CACA 049537 | 0.28 |
| CACA 049561 | 0 |
| CACA 048810 | 0 |
| CACA 048880 | 0 |
| CACA 048811 | 0 |
| CACA 048649 | 4.02 |
| CACA 049016 | 0.31 |
| Mean of Weighted Averages | 4.61 |
Using this method, we calculated overall GRank, SRank, ESA, CESA, and CNPS scores for all three development scenarios. We then added the overall GRank, SRank, ESA, CESA, and CNPS scores for each scenario to achieve an average impact score for each scenario (Table 8). Since we used the mean of the weighted averages to determine impact scores for each classification system, average impact scores can be compared even though there are an unequal number of facilities in the three scenarios.
| GRank | SRank | ESA | CESA | CNPS | AVERAGE Impact of a Facility within each Scenario | TOTAL Scenario Score (Sum of Facility Scores) | |
|---|---|---|---|---|---|---|---|
| Fast Track | 4.61 | 4.08 | 5.12 | 4.61 | 1.05 | 19.47 | 195 |
| SESA | 3.74 | 2.84 | 1.9 | 1.69 | 0.85 | 11.02 | 220 |
| All Proposed | 6.02 | 5.35 | 5.96 | 5.36 | 1.93 | 24.62 | 1280.0 |
Facilities in the All Proposed scenario have the greatest impact to rare and endangered species with an average facility score of 24.62, the Fast Track scenario has the second greatest impact with an average facility score of 19.47, and the SESA scenario has the least impact with an average facility score of 11.02. The sum of all facilities scores was also taken, resulting in a total score for each scenario. The Fast Track scenario had the lowest total scenario score, with a score of 195, followed by the SESA scenario (220), and the All Proposed scenario (1,280). It is understandable that the Fast Track scenario has the lowest score because it has the fewest number of facilities while the All Proposed scenario has the highest score because it has most number of facilities. However, considering that the SESA scenario has twice as many facilities as the Fast Track scenario, there is surprisingly little difference between the total scenario scores. The small difference between the Fast Track and SESA total scenario scores is supported by the average impact scores, because the average impact score of a SESA facility is lower than the average impact score of a Fast Track facility.