Creating a Scoring System
Each classification system (GRank, SRank, ESA, CESA, CNPS) was assigned a numerical scoring system on a scale of 0-60, with a score of 0 reflecting low sensitivity and a score of 60 reflecting high sensitivity. For example, a GRank of “G1” was given a score of 60 while a GRank of “G5” was given a score of 20. For GRank and SRank, species were occasionally given two ranks (such as “G3G4”) in which case the average numerical score was taken. For a full list of all the numerical scores given to each classification system see Appendix E3.
Species in the CNDDB were given scores under each of the five classification systems. For example, the Coachella Valley fringe-toed lizard (Uma inornata) is rated at G1 (critically imperiled globally) under the GRank classification system and was given a score of 60. The lizard also was given scores under the SRank, ESA, and CESA classification systems: 30, 50, and 60 respectively. Since only plants are scored under the CNPS system, the lizard was given a score of zero. In the map created for the GRank classification system, the lizard’s habitat was given its score of 60. In the SRank map, those same areas of land were given its SRank score of 30. The same method was used for the ESA, CESA, and CNPS maps.
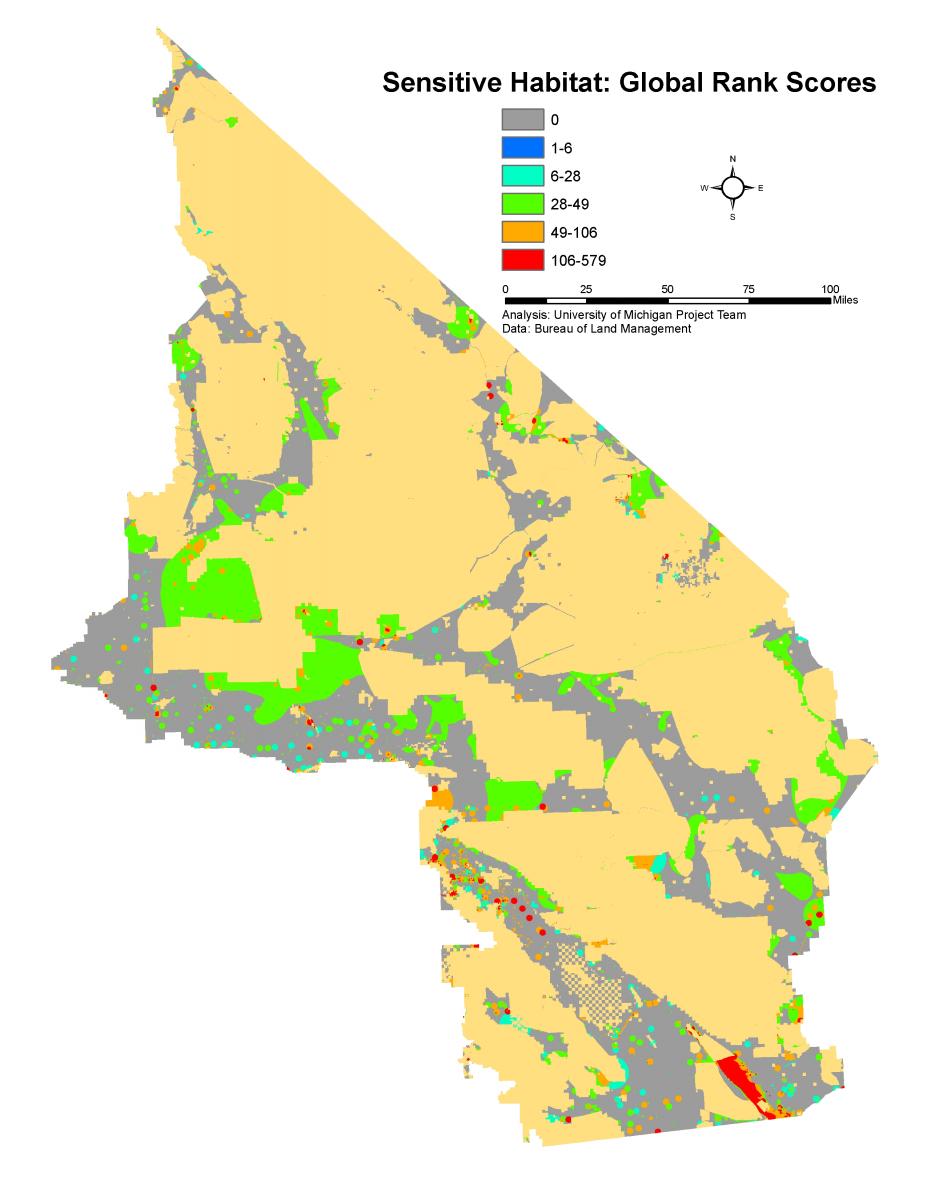
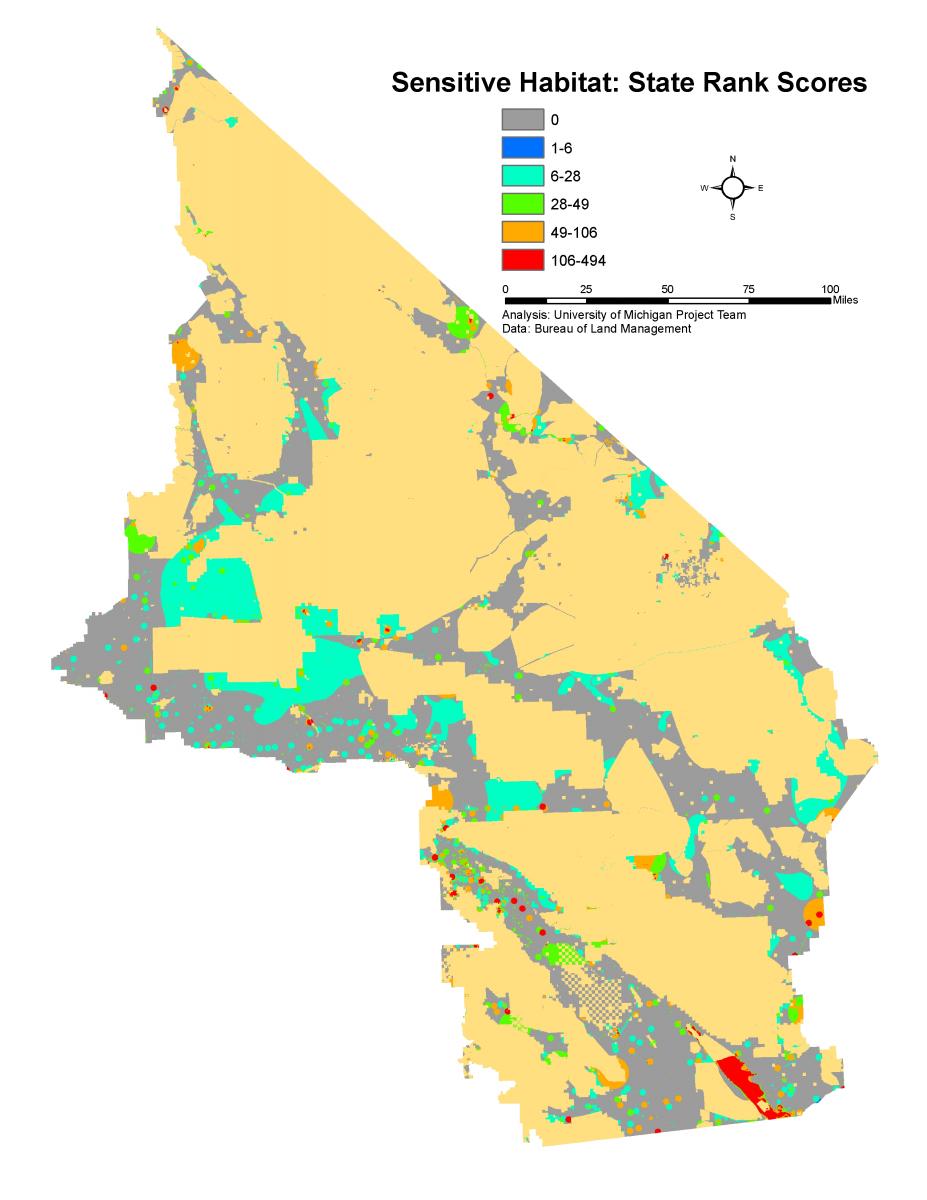
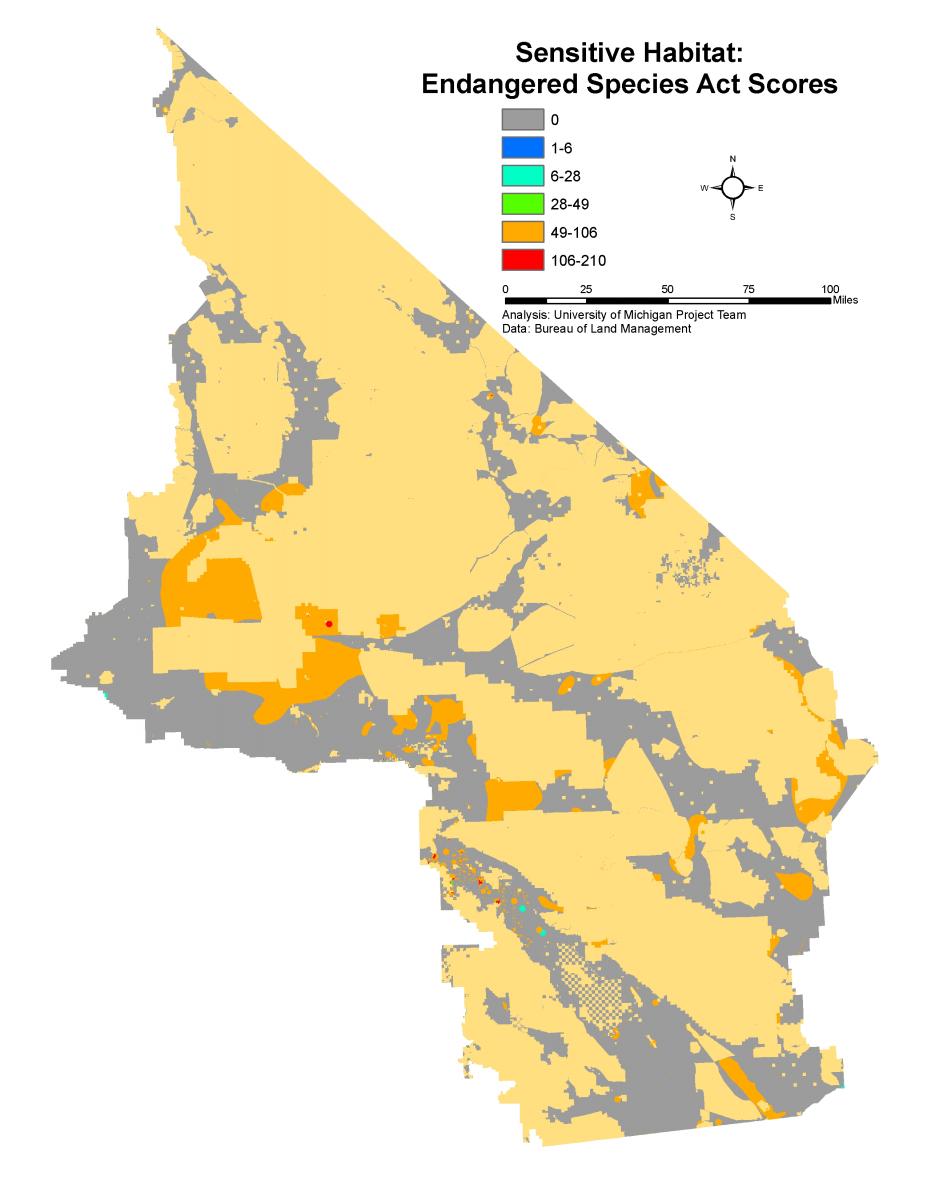
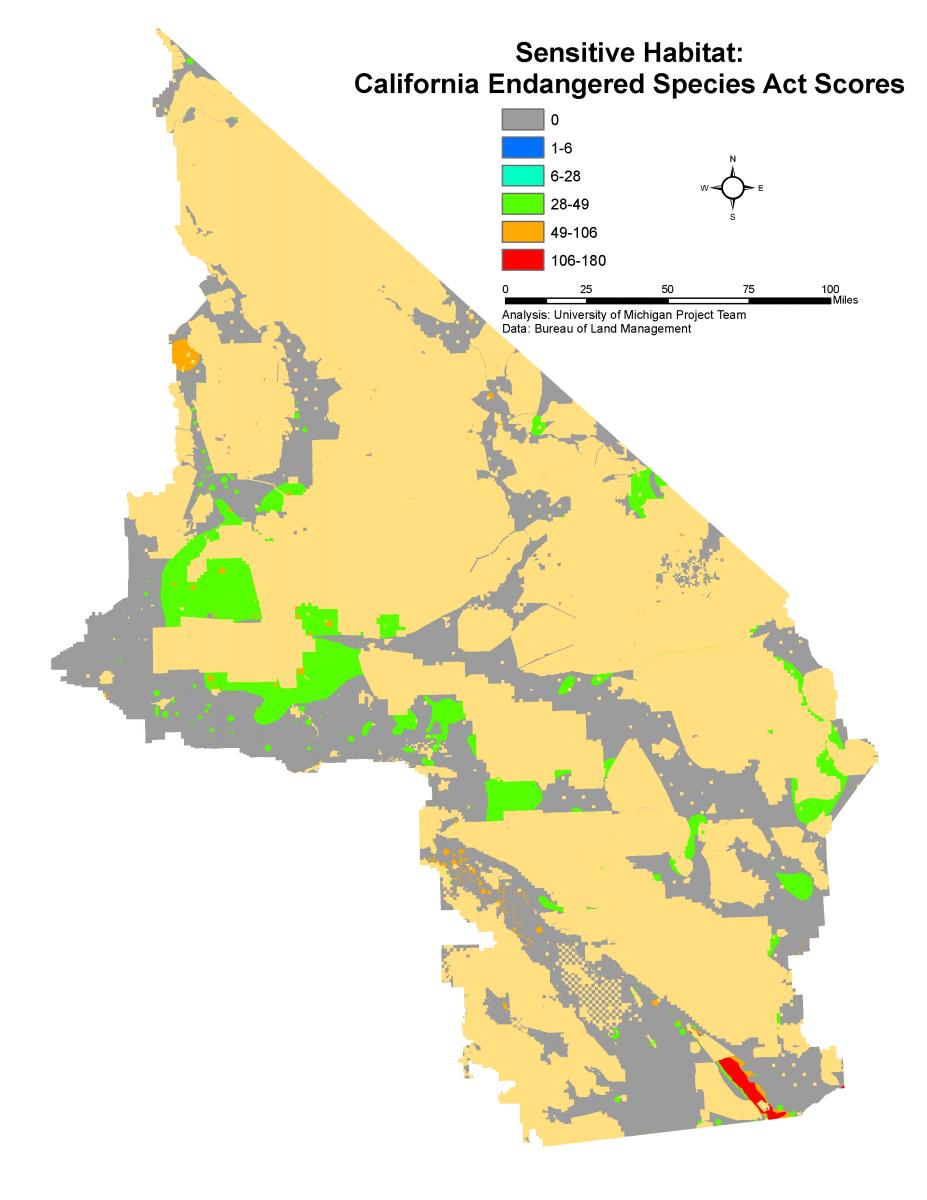
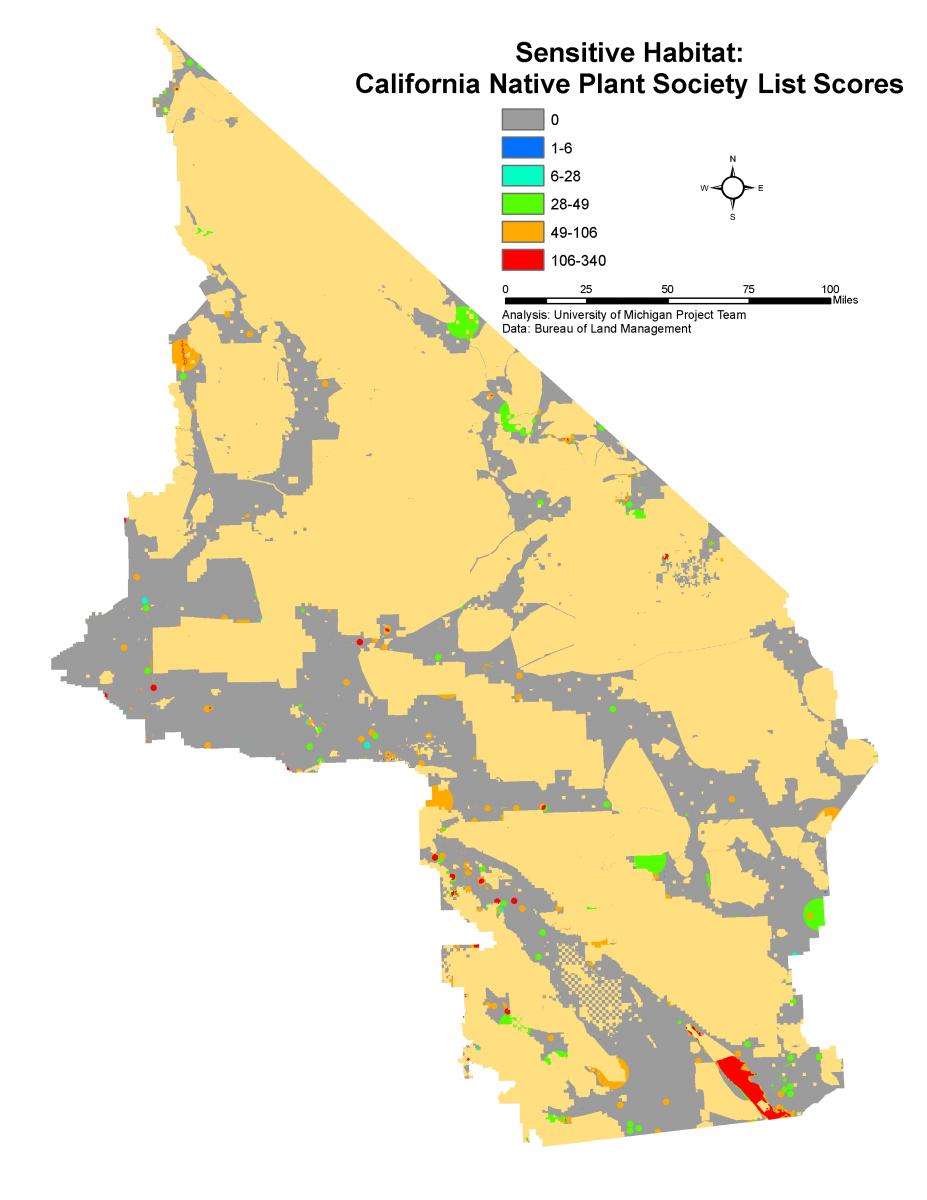
A map of numerical scores was created for each individual classification system: GRank (Map 1), SRank (Map 2), ESA (Map 3), CESA (Map 4), CNPS (Map 5). Where habitat of multiple species overlapped, the numerical scores were added together. Natural breaks in the resulting scores were used to categorize sensitive habitat into different colors on the maps. Areas with a high concentration of overlapping sensitive habitat had higher numerical scores. An example of overlapping habitat is provided by Figure 1.
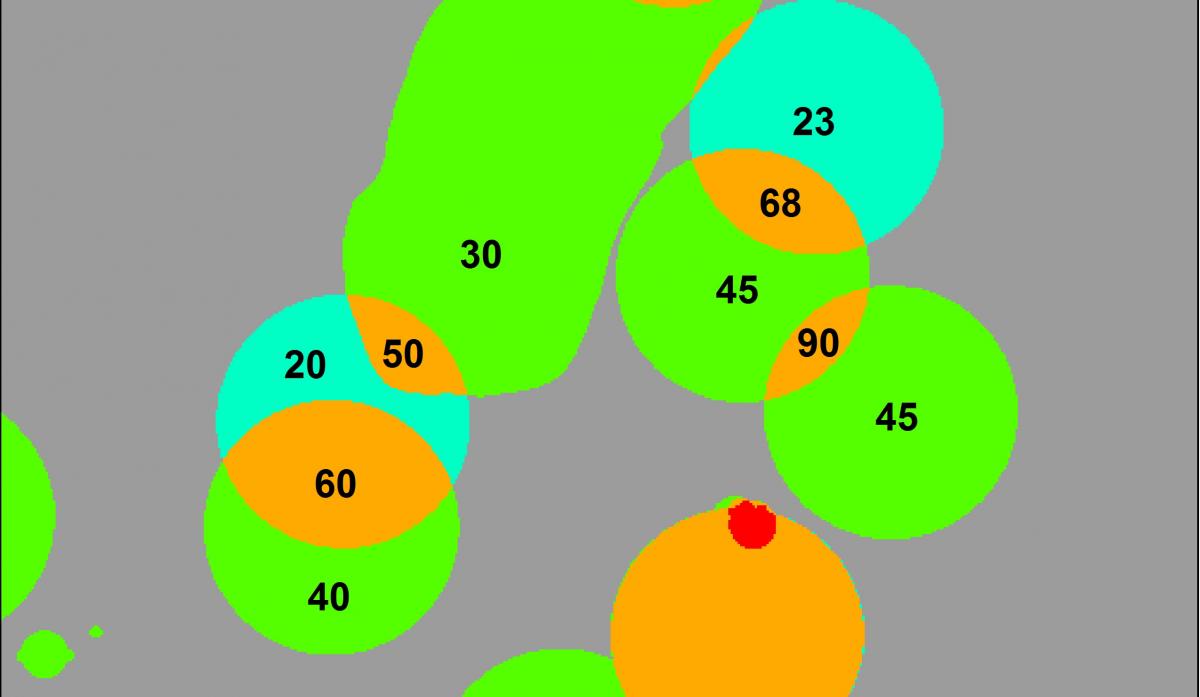
The circles and large, irregular green shape in Figure 1 indicate the habitat of several different species. In this figure, the gray areas have a score of zero, dark blue areas have scores of 1 to 6, light blue areas have scores of 6 to 28, green areas have scores of 28 to 49, orange areas have scores of 49 to 106, and red areas have scores higher than 106. Where two green circles, each with scores of 45, overlap the resulting score is the sum, 90. Overlapping species habitats are prevalent throughout our study area, as seen in Maps 1 to 5.