Attitudes Toward Utility-Scale Solar Development
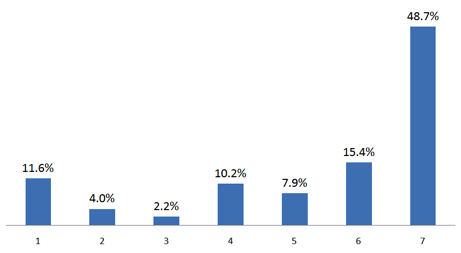
In aggregate, respondents generally favored utility-scale solar development, with a mean rank of 5.4 on a scale of 7, with nearly half of all respondents across the three communities marking 7 or “very supportive” of solar development (Figure 1). The distribution was clearly skewed toward extreme support, bottoming out at mild opposition, and trending back upward toward extreme opposition.
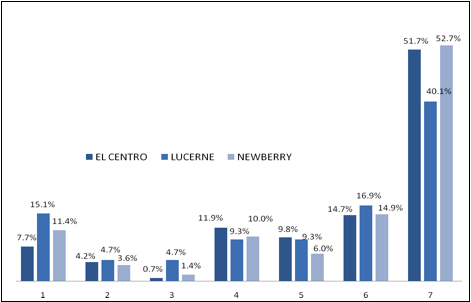
Geographically, the three communities showed similar results, although Lucerne Valley residents reported slightly more opposition to and less support for solar, roughly 3.5 percentage points greater than the overall mean and nine percentage points less than the overall mean, respectively (Figure 2). Reasons for this do not appear to be related to differences in age, residence time, or education levels across the respondents. In fact, distribution in age, residence time, and education level was generally flatter for Lucerne Valley than for the other two communities, where age and residence time trended in different directions. Lucerne Valley was in the middle. Likewise, community economic indicators did not distinguish Lucerne Valley from the other two communities. For example, at 27 percent, El Centro has a much higher rate of unemployment than do the other two communities, at five percent, respectively.1 Participation in the process, however, did vary slightly: 19.4 percent of respondents from Lucerne Valley claim to have participated in BLM public comment opportunities, compared to 12.7 percent for El Centro and 17.8 percent for Newberry Springs. Absentee ownership appeared to play no role. As such, residents of Newberry Springs and El Centro appear to be more aligned in public opinion than residents of Lucerne Valley. A deeper dive into why Lucerne Valley appears to exhibit slightly less support for utility-scale solar, such as handling of the process, could be a useful follow up to our survey.
It is not clear whether age is a significant differentiator in terms of overall opinion. Respondents less than 40 years old exhibited slightly less extreme opposition to solar, at 5.4 percent ranking support atone versus 12.3 percent for the other two age groups. That said, only 9.6 percent of respondents reported to be less than 40 years old — 58 in total — and may not accurately represent that demographic. Additionally, those who had lived in their respective community for a shorter period of time tended to report slightly more support for solar than those who had lived in the region for more than 10 or 20 years, 48 percent and 41 percent, respectively. However, the distribution is generally the same.
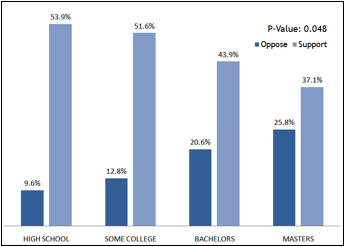
The one demographic category in which support appeared to be more divergent from group to group was education level. Interestingly, the more educated people were, the less they tended to support solar and the more they tended to oppose it, as measured by mean response. In addition, those with higher education claimed to be more familiar with various solar technologies than those with less education (Figure 3). This trend had a significance level of 0.05 and a p value of 0.048, as calculated using a chi square test in Table 1.
There might be several reasons for this trend. For instance, those who have higher levels of education might know more about the negative impact solar could have on plant and animal habitats than those who do not, and might therefore be more apt to oppose development. In fact, those with more higher education did, on average, have a greater concern for loss of habitat, and a qualitative analysis of open-ended questions suggest that those with more higher education are concerned about local plant and animal habitats, as well as viewsheds. But a pattern of greater or less concern from one education category to another was not discernable in the mean response, and tests did not return statistically significant results. Reasons behind this trend are therefore speculative.
| Chi Squared Test for Independence | Education Level and Attitude toward Solar | |||||
|---|---|---|---|---|---|
| Observed | |||||
| High School | Some College | Bachelors | Masters | Total | |
| Oppose Solar | 10 | 27 | 16 | 16 | 69 |
| Support Solar | 64 | 133 | 47 | 36 | 280 |
| Total | 74 | 160 | 63 | 52 | 349 |
| Expected | |||||
| Oppose Solar | 14.63037249 | 31.63323782 | 12.45558739 | 10.28080229 | 69 |
| Support Solar | 59.36962751 | 128.3667622 | 50.54441261 | 41.71919771 | 280 |
| Total | 74 | 160 | 63 | 52 | 349 |
| Chi Squared | |||||
| Oppose Solar | 1.465468458 | 0.678618257 | 1.008612467 | 3.181582671 | 6.334281854 |
| Support Solar | 0.361133299 | 0.167230928 | 0.248550929 | 0.784032873 | 1.560948028 |
| Total | 1.826601757 | 0.845849185 | 1.257163397 | 3.965615544 | 7.895229882 |
| p-value | 0.04823 | ||||
Negative and Positive Impacts
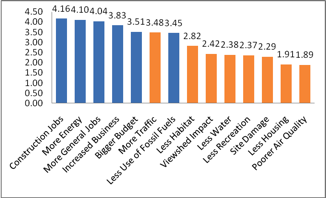
We asked respondents to rank, on a 5-point scale, the likelihood of various potential impacts of utility- scale solar development (Figure 4, Table 2). The outcomes that respondents thought were most likely to occur were positive in nature and consistent with their overall support for solar: more construction jobs (4.16 out of 5), more energy available to them (4.10 out of 5), and more post- construction jobs (4.04 out of 5). Respondents also placed the most value on these outcomes, rather than on other potential outcomes.
Respondents in Lucerne Valley, where residents appear to be generally less supportive of solar development, tended to fall slightly below the mean on these three categories. In other words, they reported to be less convinced that these outcomes will happen. On the other hand, residents of Lucerne Valley also did not report to believe that negative impacts are more likely to happen than did residents in Newberry Springs or El Centro.
| What Issues Rise to the Top? | ||
|---|---|---|
| Question Type | Highest Ranked | Second Highest Ranked |
| Most Likely to Occur | More Construction Jobs | More Energy for Community |
| Least Likely to Occur | Poorer Air Quality | Decrease In Housing |
| Least Certainty About | Negative Impact On Water | Increased Town Budget |
| Greatest Cause of Concern | Negative Impact On Water | Decreased Natural Habitat |
| Greatest Potential Value | More Energy For Towns | More Post-Construction Jobs |
| Most Valuable Additional Info | Water Use Estimates | Job Creation Estimates |
Aggregated across all three communities, respondents tended to report that less housing (1.91 out of 5) and poorer air quality (1.89 out of 5) were least likely to happen. On the other hand, water rose to the top of concerns across all three communities, registering an average of 3.2 on a 5 scale. Interestingly, more than 14 percent of respondents reported to not know if water would be affected, the potential outcome with the greatest share of respondents who could not commit to an opinion about its likelihood of occurring. Therefore, while many are unsure about the impact of solar on water resources, they appear to be somewhat concerned about it. Concern over water, as well as a desire for jobs, fit the socioeconomic and geographic realities of these desert communities, where water is scarce and the unemployment is high — more than 27 percent in El Centro.2