Information Gaps and Sources
The survey that we developed and distributed included a range of questions about respondents's familiarity with solar technologies and nearby proposed utility-scale solar facilities. These questions were designed to help determine the subject areas where community members still wanted more information and which information sources they found to be most and least valuable. After performing a statistical analysis on all the received responses, we've summarized our findings about information gaps and key sources.
Overall, respondents claimed to be moderately familiar with solar technologies (2.94 out of 5). On average, respondents claimed to be most familiar with parabolic trough technologies, although the data suggest that respondents are more familiar with solar energy in general than they are with specific technologies. Generally, people in El Centro reported to have less familiarity than those in Newberry Springs, and older respondents claimed to know more than younger ones. In addition, those with only a high school education reported to be less familiar with solar technologies than those with a master’s degree. Finally, those who oppose solar appeared to claim slightly more familiarity with solar than those who support solar (Table 1). However, when regressed against opinion, knowledge of solar is not statistically significant to opinion (R-squared = 1.24 x 10⁶). Table 1 offers a rough profile of those who reported to be most familiar with solar and those who reported to be least supportive of utility-scale solar development in their region.
| Familiarity With Solar | ||
|---|---|---|
| Category | Most Familiarity | Least Familiarity |
| Community | Newberry Springs | El Centro |
| Age | 60 or Older | 40 or Younger |
| Residence Time | Less than 10 Years | 10 to 20 Years |
| Education Level | Masters | High School |
| Support for Solar | Oppose | Support |
In addition, opponents of solar reported to be more familiar with solar technologies (2.40 out of 5) than did supporters (1.94 out of 5). But neither group claimed to be "very familiar". In terms of information sources, we did notice a statistically significant difference in the values assigned to local government as a source of information. Supporters reported 2.35 out of 5, and opponents 2 out of 5, meaning neither group holds local government in particularly high regard. Finally, opponents (at 30.4 percent) claim to participate more than supporters (at 16.2 percent), and opponents were again slightly more cynical about the participation process than supporters, with 29.7 percent reporting that their opinion "does not matter or will make no impact" versus 17.5 percent, respectively.
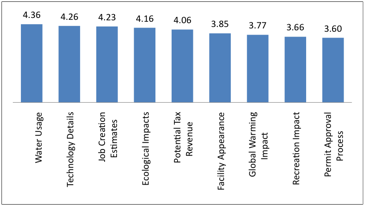
Additionally, the survey helped identify the subject areas where community members still wanted more information about solar facilities. The question itself was, “In the future, how helpful would you find the following information about utility-scale solar facilities?”. We also sought to know what people who support and oppose solar want to know. Respondents were asked to rank preferences on a scale of five, and as such, we looked at mean answers above three as being helpful and mean answers below three as trending toward less helpful. Assuming that logic, respondents on the aggregate indicated that all the provided information options would be helpful to them, to varying degrees. In fact, none of the nine received a mean score of less than three when filtered through each of the four demographic categories designed into the survey (Figure 1). Given that the greatest proportion of respondents said they were uncertain if utility-scale solar would have an impact on water resources, and that impact over water resources was reported to be the greatest concern, it might not be surprising that more information on water usage rose to the top as the most helpful. Details on the technology itself, job creation estimates, and ecological impacts fell behind water, in that order. In our observation, nothing else with regard to helpfulness of additional information stood out in the data as being significant.
Information Sources
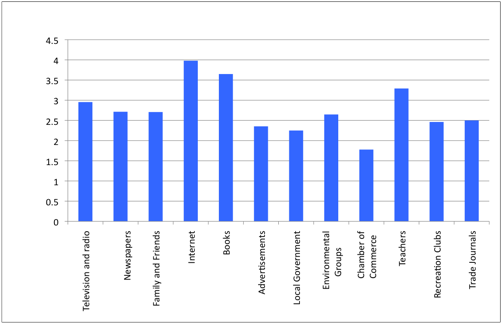
From a list of 12 possible sources for solar information, 85 percent of respondents chose television and radio as their most helpful information source. Eighty-two percent use newspapers, 79 percent listen to family and friends, and 78 percent rely on the internet. Far fewer respondents reported to glean information from trade journals (at 60 percent), recreation clubs (at 63 percent), or teachers (at 63 percent). Drawing from Figure 2, mass media is seen as less valuable, even though it is consumed at a higher rate than books and the internet. In addition, advertisements and the government are viewed as the least useful, which is consistent with a number of the open-ended responses we received that indicated a lack of trust in big business, government, and the Bureau of Land Management (BLM) generally.
Respondents from Lucerne Valley tended to find these government sources less valuable than the mean, rating both local government and the Chamber of Commerce below a ranking of two on the five-point scale. This observation appears to be consistent with the overall opinion of respondents from Lucerne Valley, which is less than the mean.